Pages

Wednesday, June 23, 2021

May 2021 Employment and Unemployment in Oregon’s Counties

In May 2021, 19 out of 36 of Oregon’s counties experienced over-the-month decreases in their unemployment rates. Nine counties experienced increases in their unemployment rates over the month, and eight counties experienced no change in their unemployment rates. Lake and Wallowa counties saw the largest over-the-month increase at 0.6 percentage points each in May. 

Lincoln County had Oregon’s highest seasonally adjusted unemployment rate in May at 7.7%. Other counties with some of the highest unemployment rates included Curry (7.6%), Crook (7.5%), Klamath (7.4%), and Grant (7.3%) counties. 

Wheeler County registered the lowest unemployment rate for the month at 3.5%. Other counties with some of the lowest unemployment rates in May were Benton (4.6%) and Malheur (5.6%) counties. Fifteen counties had unemployment rates at or below the nationwide rate of 5.8%, as well as the statewide rate of 5.9%. 


Total nonfarm payroll employment increased in all six of Oregon’s broad regions between May 2020 and May 2021. Most areas still have room to recover from pandemic job losses; the state has now recovered 62% of jobs lost in March and April 2020. The largest job increases since May 2020 occurred on the Coast (14.8%). Central Oregon (11.0%), the Willamette Valley (7.7%), and Southern Oregon (7.4%) also experienced large over-the-year employment increases. Eastern Oregon and the Portland-5 regions added 6.7% and 6.2%, respectively.


Read the original release at QualityInfo.org.


Tuesday, June 15, 2021

Oregon Adds 6,900 Jobs in May

In Oregon, nonfarm payroll employment grew by 6,900 in May, following monthly gains averaging 11,400 in the prior four months. Monthly gains in May were largest in private education (+3,400 jobs); professional and business services (+2,900); construction (+900); and financial activities (+900). Only one major industry shed more than 500 jobs in May: transportation, warehousing, and utilities (-800 jobs).

In May, Oregon’s nonfarm payroll employment totaled 1,864,000, a drop of 109,000 jobs, or 5.5% from the prerecession peak in February 2020. Oregon’s employment dropped to a low of 1,687,500 by April 2020. Since then, Oregon has recovered 176,500 jobs, or 62% of the jobs lost between February and April 2020. 

Leisure and hospitality accounts for the bulk of Oregon’s jobs not recovered since early 2020. It employed 169,600 in May, and added only 1,600 jobs in the most recent two months. The industry is still 46,700 jobs below its peak month of February 2020, so it accounts for 43% of overall nonfarm payroll jobs lost since Oregon’s prerecession peak. The restaurants, bars, and hotels that make up accommodation and food services have shown flat hiring trends over the most recent three months; the employment level in this component industry has been close to 150,000 in March, April, and May.

Read the full press release on Qualityinfo.org

Monday, June 7, 2021

Oregon Construction Employment Near Record Highs

Oregon’s construction industry reached near a record high number of jobs in recent months, employing approximately 110,000 on a seasonally adjusted basis. The industry bounced back quickly from the COVID recession in which it spiked down to about 100,000 jobs in April 2020. Prior to that, the industry added jobs steadily and rapidly during 2013 through 2019, following a prolonged slump in 2009 through 2012, when employment remained near 70,000 for several years after the 2008-09 recession.

Looking back more than 30 years, clearly the industry has been highly cyclical – experiencing booms and busts over the course of multi-year expansions that were followed by briefer, but potentially precipitous contractions.

In the late 1990s the industry hovered close to 80,000 jobs for several years, dropped some jobs in a mild recession and then resumed its climb. Just before the 2008 recession, Oregon’s construction industry was slightly below today’s employment total, at about 104,000 jobs.

Housing Starts Increasing But Still  Well Below Historical Highs

One of the reasons that the economic expansion between 2013 and 2019 – both in Oregon and at the national level – was so long and persistent was due to the pattern of housing starts. In the several years immediately following the 2008-09 recession, building permits and housing starts were very low by historic standards. The low level of residential construction activity and spending was a limiting factor for economic growth, given that new-home building is a major component of change in the overall dollar value of economic activity for a region. In Oregon, residential building permits (single-family and multi-family combined) stagnated near an average monthly rate of 600 during 2009 through 2011, but have since climbed to the current rate averaging close to 1,600 per month over the past five plus years. Despite the near-tripling of monthly housing permits in the timespan, we’re still well below peak levels seen during several periods during the 1990s and mid-2000s, not to mention the house-building boom in the late 1970s, when building permit activity was double the current level.

To learn more, read Current Employment Statistics Coordinator David Cooke's full article.

Thursday, May 27, 2021

Diversity Among Asian and Pacific Islanders in Oregon

May is national Asian and Pacific Islander Heritage Month. Here are some facts about the diverse Asian, Native Hawaiian, and other Pacific Islander communities in Oregon.

Oregon's Asian, Native Hawaiian, and other Pacific Islander populations are diverse, young, and growing. In 2019, there were an estimated 246,789 Oregon residents who identified as Asian and 34,407 who identified as Native Hawaiian or other Pacific Islander alone or in combination with one or more other races. 66,200 people in Oregon identified as Asian in combination with one or more other races on average from 2015 to 2019 or 27% of all people of Asian heritage in the state. 

Taking a closer look at the Asian alone population, nearly one out of four people were of Chinese ancestry (24%), followed by those of Vietnamese (17%), Indian (14%), and Filipino (11%) ancestry. More than half (52%) of Oregon’s Native Hawaiian or other Pacific Islander population also identified as being one or more other races. Looking at more detailed breakouts for the 16,625 who identified as Native Hawaiian and other Pacific Islander alone, roughly one out of four (24%) are Native Hawaiian, 11% are of Guamanian or Chamorro ancestry, and another 10% are Samoan. More than half (55%) are of some other Pacific Islander ancestry.
Two out of three of Oregon’s Asian alone residents (65%) and one out of three Native Hawaiian or other Pacific Islanders (33%) were foreign born on average from 2015 to 2019. This compares with 10% of all Oregonians. Those born outside of the United States who move here come for a variety of reasons including higher education, work, marriage, and safety reasons. Seven out of ten (69%) of the state’s Asian, Native Hawaiian, or other Pacific Islander alone population speak a language other than English, most often in addition to English, and roughly 28% have limited English speaking proficiency.

Asian and Native Hawaiian and other Pacific Islander populations have grown much faster in Oregon than the state’s overall population (9.8%) from 2010 to 2019, growing by 33.3% and 37.4% respectively. From 2015 to 2019, the median age for all who identified as Asian alone in Oregon was 36.6 years compared with to 39.3 years for all Oregonians. Native Hawaiians and other Pacific Islanders had a median age of 30.2 years during this same period.

There is much diversity among the growing Asian and Pacific Islander populations in Oregon, and specific groups may have their own socioeconomic needs. More detailed research about these communities will be published on QualityInfo.org in the coming days.


Tuesday, May 25, 2021

April 2021 Employment and Unemployment in Oregon’s Counties

 In April 2021, 19 out of 36 of Oregon’s counties experienced over-the-month increases in their unemployment rates. Curry and Morrow counties saw the largest over-the-month increase at 0.3 percentage points each in April. Nine counties experienced decreases in their unemployment rates over the month, and eight counties experienced no change in their unemployment rates.

Lincoln County had Oregon’s highest seasonally adjusted unemployment rate in April at 8.3%. Other counties with some of the highest unemployment rates included Curry (7.9%), Grant (7.7%), Crook (7.6%), and Klamath (7.6%) counties. 

Wheeler County registered the lowest unemployment rate for the month at 3.3%. Other counties with some of the lowest unemployment rates in April were Benton (4.7%) and Sherman (5.0%) counties. Sixteen counties had unemployment rates at or below the nationwide rate of 6.1%. Thirteen counties also had unemployment rates at or below the statewide rate of 6.0%.


Total nonfarm payroll employment increased in all six of Oregon’s broad regions between April 2020 and April 2021. This reflects the recovery period since employment in Oregon hit its lowest levels in the current pandemic recession. Most areas still have room to recover from pandemic job losses; the state has now recovered 59% of jobs lost in March and April 2020. The largest job increases since April 2020 occurred in the Coast (17.3%). Central (15.5%), Southern (10.2%), and Willamette Valley (8.2%) also experienced large over-the-year employment increases. Eastern Oregon and the Portland-5 regions added 8.0% and 6.7%, respectively.


Next News Releases

The Oregon Employment Department will release statewide unemployment rate and industry employment data for May 2021 on Tuesday, June 15, 2021. The May 2021 county and metropolitan area unemployment rates will be released on Tuesday, June 22, 2021.  


Tuesday, May 18, 2021

Oregon Job Growth Slowed to 2,200 in April

Hiring in Oregon slowed significantly in April. Total nonfarm payrolls added 2,200 jobs, following a revised gain of 19,600 in March. Oregon's unemployment rate was unchanged at 6.0%.

Job growth also slowed nationwide in April, and the U.S. unemployment rate was 6.1%. Oregon has regained 59% of the jobs lost in spring 2020, compared with 63% for the U.S.

April job gains in Oregon were largest in government, which added 2,300 jobs as many K-12 schools moved from fully remote to partially in-person instruction. Leisure and hospitality added 2,000 jobs over the month. Monthly declines were largest in manufacturing, which dropped by 900 jobs.

Although Oregon's unemployment rate hit a stand-still in April, underlying labor force dynamics continued to shift. April marked the first month since the pandemic recession started that those experiencing permanent job losses were the largest group of laid off Oregonians. At the height of the pandemic shutdowns a year ago, nine out of 10 layoffs were temporary. 

More information about Oregon's employment situation is available in the full news release, or in the monthly video summary.


Monday, April 26, 2021

Why Oregon's Labor Market is Tighter Than You Think

We've been hearing more in recent days about employers' challenges finding workers. Over the past week, we've teamed up with the Office of Economic Analysis to publish a summary of reasons Oregon's labor market is tighter than you might think.

The pandemic recession -- just like all economic downturns -- is unique. During this recovery labor demand remains strong. At the same time, several simultaneous factors are constraining the supply of labor for those job openings. They include:

1. Concentrated Nature of the Shock
Last spring, many businesses with similar labor pools shut down overnight. The economy experienced record-setting job losses and the unemployment rate increased nearly 10 percentage points in April 2020 alone. Those who remain unemployed are also largely on temporary layoff. In the previous recessions, the job losses were largely permanent, and the economic nadir did not occur until more than two years into each cycle, so businesses hiring during the recession and recovery had excess labor supply for a while. During this recovery the jobless numbers have dropped much faster.

Oregon’s unemployment rate matched the nation’s at 6.0% in March, below the average of 6.8% over the past two decades. Currently, hiring employers are facing a typical or slightly lower-than-typical available labor pool for their job openings. The available labor force is not evenly distributed either. While all sectors lost jobs in the initial COVID downturn, some have bounced back rapidly or hit new employment highs (such as transportation, warehousing and utilities, and professional and technical services). Depending upon the types of jobs employers are hiring for, there may be no excess labor. 

2. Pandemic Concerns
The unemployment rate doesn’t include would-be workers who are out of the labor force, meaning they neither have a job, nor are they looking for one. Supplemental information from households in the Current Population Survey shows an estimated 45,000 people in Oregon said they were prevented from looking for work due to COVID-related reasons during the first quarter of 2021. While vaccinations have accelerated, only about half the adult population has received at least one vaccine dose for COVID-19 as of mid-April. COVID case counts are also rising in many areas of Oregon again this spring.

3. Lack of In-Person Schooling
Heading into the pandemic, one out of every six Oregonians in the labor force had kids, worked in an occupation that cannot be done remotely, and also did not have another non-working adult present in the household, according to research from the Office of Economic Analysis. As of mid-April, three-fourths of Oregon’s K-12 schools have students learning remotely from home either part- or full-time, according to Oregon Department of Education records.

Even with the anticipated return of full-time, in-person learning for the 2021-2022 school year, child care slots, which were already too scarce in most areas of the state prior to the pandemic, and summer programs will likely continue operating with reduced capacity for some time. These constraints limit workforce options for some parents of younger children.

4. Federal Aid and Unemployment Benefits
Total personal income in Oregon today is about 15% higher than before the pandemic. Strong federal fiscal policy response via recovery rebates alone added $12 billion to personal income in Oregon. Although this has brightened the overall economic outlook, a stronger safety net where incomes are higher today than pre-COVID can temporarily reduce labor force participation in the short term for some workers. 

Federal Pandemic Unemployment Compensation (FPUC) adds $300 onto weekly unemployment insurance benefits through September 4, 2021. In the first quarter of 2021, the weekly regular unemployment (UI) benefit has averaged $370 per week. With the additional $300 FPUC payment, that adds up to an average payment of $670 per week. That’s roughly the same as earning $16.75 per hour for someone working full time. During the first quarter of 2021, that has also represented full wage replacement (between 100% and 104%) relative to regular UI claimants’ pre-pandemic earnings on the job. 

Some perspective here: earning $670 per week, working year round would total $34,800 in gross earnings for a worker. By comparison, the median earnings for full-time workers in Oregon in 2019 was $50,712. With “Now Hiring” signs in many business windows and stronger wage offerings as employers compete for available workers, it’s unlikely that this benefit, in itself, is keeping a vast number of workers on the sidelines.

Furthermore, unemployed workers cannot refuse job offers or a recall to their previous job (if temporarily laid off) because of their unemployment benefit amount. Refusing work solely due to weekly unemployment benefit payments would be considered fraud. The Employment Department provides ways to report job refusals.

Last but not least, Oregon has a long-running record of adding labor force through net in-migration of workers from other states and areas. While Oregon continued to attract migrants in 2020, net migration fell to its lowest level since 2013 in Oregon, and was 20% lower at 28,600 than in 2019.  

More information on Oregon's current labor market dynamics can be found in the full article and OEA blog post, written by State Economist Josh Lehner and State Employment Economist Gail Krumenauer.

Wednesday, April 21, 2021

Oregon’s 2020 Natural Population Increase Was the Lowest on Record

In 2020, Oregon’s population increased by 31,655 to 4,268,055. This marked growth of 0.7% over the year and growth of 11.4% since the 2010 Census. Portland State University’s Population Research Center recently released more detailed information on why this population growth has occurred.

Two things lead to population change. First, an area increases in population if more births than deaths occur in a given year. Second, population can increase or decrease through net migration. That is, over the year, people either move into or out of an area. A positive value of net migration means more people moving into an area than leaving it, while a negative value of net migration indicates more people leaving an area than moving in.

In 2020, 90% of Oregon's population increase was due to net migration. Natural increase contributed just 3,100 to population growth, which was the lowest since comparable records began in 1960. The low natural increase is caused by an increase in the number of deaths (37,800), which was the highest total since 1960. In 2018 and 2019, there were 36,600 deaths in Oregon each year. Since 2011, Oregon had a relatively low natural increase compared with the prior four decades.


While Oregon continued to attract migrants in 2020, net migration was 20% lower at 28,600 than it was in 2019. The number of net migrants has been dropping steadily over the past few years since 2017, likely driven by a slower growing economy towards the end of the last economic expansion and housing availability and affordability. The current economic crisis driven by public health restrictions related to the COVID-19 pandemic contributed to continued declines in net migration in 2020.

To learn more, read Economist Sarah Cunningham's full article here

Tuesday, April 20, 2021

March 2021 Employment and Unemployment in Oregon’s Counties

In March 2021, 24 out of 36 of Oregon’s counties experienced over-the-month decreases in their unemployment rates. Clatsop and Union counties saw the largest over-the-month decrease, declining 0.9 percentage point each in March.

Lincoln County had Oregon’s highest seasonally adjusted unemployment rate in March at 8.0%. Other counties with some of the highest unemployment rates included Grant (7.5%), Curry (7.4%), Coos (7.3%), and Crook (7.3%) counties. 

Wheeler County registered the lowest unemployment rate for the month at 3.8%. Other counties with some of the lowest unemployment rates in March were Malheur (4.4%) and Sherman (4.6%) counties. Eighteen counties had unemployment rates at or below the statewide rate of 6.0%. Eighteen counties also had unemployment rates at or below the nationwide rate of 6.0%.


Total nonfarm payroll employment declined in all six of Oregon’s broad regions between March 2020 and March 2021. The largest job losses occurred in the Portland-5 (-7.8%). The Coast (-6.3%), the Willamette Valley (-5.8%), and Central Oregon (-3.6%) also experienced large over-the-year employment losses. Southern Oregon and Eastern Oregon dropped 3.0% and 2.3%, respectively.


Next News Releases

The Oregon Employment Department will release statewide unemployment rate and industry employment data for April 2021 on Tuesday, May 18, 2021. The April 2021 county and metropolitan area unemployment rates will be released on Tuesday, May 25, 2021.  

Read the original press release here. 


Tuesday, April 13, 2021

Oregon Adds 20,100 Jobs in March

Nonfarm payroll employment rose 20,100 jobs in March, following a gain of 15,300, as revised, in February. Two-thirds of all the jobs gained in March were in leisure and hospitality (+13,900 jobs). Three other major industries each added more than 1,000 jobs: manufacturing (+2,000 jobs); professional and business services (+1,300); and transportation, warehousing, and utilities (+1,100). Construction and private educational services each added 700 jobs. All other major industries performed close to their normal seasonal patterns. 

The 20,100 total nonfarm jobs added in March was Oregon’s largest monthly gain since 38,300 jobs were added in July. March’s gain was the third monthly increase, following a large drop in December that was the result of temporary, heightened restrictions at the time. In March, Oregon’s nonfarm payroll employment totaled 1,840,600, a drop of 132,400 jobs, or 6.7% from the pre-recession peak in February 2020. Oregon’s employment dropped to a low of 1,687,500 by April 2020. Since then, Oregon has recovered 153,100 jobs, or 54% of the jobs lost between February and April 2020. 

Oregon’s unemployment rate edged down to 6.0% in March, from 6.1% in February. For the past three months, Oregon’s unemployment rate has ticked down by a tenth of a point each month. During the past 11 months the pace of recovery in Oregon’s unemployment rate has mirrored the national experience. The U.S. unemployment rate dropped to 6.0% in March, from 6.2% in February.


 Read the full press release here

Monday, April 12, 2021

Oregon's Per Capita Personal Income Increased in 2020

Preliminary estimates from the Bureau of Economic Analysis' March 2021 News Release show Oregon’s per capita personal income (PCPI)--a measure of total income in the state from net earnings, transfer receipts, and dividends, interest, and rent, divided by the state's population--increased by 6.7% over-the-year in 2020 to $56,765. National PCPI increased by 5.8% to $59,729 during the same period. Large over-the-year increases in PCPI were driven by large increases in personal current transfer receipts, primarily through the $1.1 trillion in national CARES Act government relief payments.

As of 2020, Oregon’s PCPI relative to the nation increased to 95.0% of U.S. PCPI. Slightly larger over-the-year increases in transfer receipts (+37.3% for Oregon vs +36.6% for the U.S.) and net earnings (+0.7% vs. +0.3%) and a smaller over-the-year decrease in dividends, interest, and rent (-0.8% vs. -1.1%) all contributed to Oregon’s relative increase in PCPI.

Oregon's PCPI ranks 23rd in the nation. Connecticut has the nation's highest PCPI at $79,771, or 134% of national PCPI. Mississippi ranks last among the states at $41,745, or 70% of national PCPI.

Monday, April 5, 2021

COVID-19 Impacts on Oregon’s Breweries and Pubs

Last year was difficult for many types of businesses. The COVID-19 pandemic dramatically altered the way we engage the economy. Breweries and brewpubs had been posting slower rates of growth before the onset of the pandemic, but the closure of in-person dining dealt a blow to demand for kegs and employment within the pubs themselves.

In the summer of 2019 there were roughly 9,090 jobs in brewing establishments across the state of Oregon. A brewing establishment is any location that brews beer. A portion of these are manufacturing facilities that produce their beer to be distributed to retailers or restaurants. However, many of the state’s brewing establishments are brewpubs that both brew beer and serve that beer onsite in a more typical restaurant environment.

The dramatic impacts of the pandemic were first seen in second quarter 2020 when covered employment dropped by a staggering 3,500 jobs (-43%) from levels in the first quarter. The drop is even more shocking when you consider the highly seasonal nature of the industry. Typically the spring (second quarter) is a time of hiring for breweries and pubs, which means the loss of 43% of total employment from the first quarter undercounts the true impact to the industry.

As with the economy more broadly, there was an initial V-shaped recovery to employment last summer in Oregon’s brewing industry with these pubs and breweries adding back around 1,950 of the 3,500 jobs lost in the spring of 2020. Even with this sharp rebound in the third quarter, employment in breweries still remained down by around 29% from levels in 2019. As you might expect, the COVID impacts to the brewing industry were much more significant than to the overall economy, but job losses were even more significant than food services and drinking places, where employment was down by 23% from last year.
Despite the challenges faced in 2020, there is reason for optimism as we move further into 2021. The worst of the pandemic is already behind us with case counts dropping dramatically, hospitalization rates down, and vaccine rollout accelerating. Vaccines are expected to be widely available to the general public by late spring, which should lead to fewer public health restrictions and consumers feeling more comfortable going out to public places such as brewpubs. Combine the “opening” of the economy with the large savings rate and we will likely see a dramatic increase in spending at restaurants. More people in restaurants means more people drinking Oregon beer.

To learn more, read Regional Economist Damon Runberg's full article here

Wednesday, March 31, 2021

From Peak to Pandemic: 2020 in Review

Oregon’s longest post-WW II economic expansion came to a dramatic end in 2020. The cumulative devastation Oregonians faced in their lives and their livelihoods throughout 2020 translated to slow recovery from unparalleled job losses.

The pandemic recession had a faster onset with deeper impacts than even the Great Recession. The record-breaking layoffs that occurred in the spring of 2020 in response to the COVID-19 pandemic also occurred at breathtaking speed. Oregon lost 285,500 nonfarm payroll jobs from February to April, a decline of 14.5%. By comparison, at the steepest point of decline in the Great Recession, 27 months into the downturn, employment had dropped 8.5% from its peak. 


One distinction of the pandemic recession was that overwhelmingly, those who became unemployed due to job loss were on temporary layoff. At peak unemployment in April 2020, those who lost jobs accounted for 84% of unemployed Oregonians. Among them, 86% were classified as on temporary layoff. That’s quite a reversal from the Great Recession; during its months of highest unemployment, nearly three-fourths (72%) of layoffs were due to permanent job losses.

In addition to those who lost jobs – temporarily or permanently – many more Oregonians found themselves working less than they would have liked in 2020. Oregon’s broadest (“U-6”) measure of labor underutilization hit a series high of 20.9% in April 2020. That means one out of five workers or would-be workers were either out of work, discouraged from looking due to lack of prospects, sought work in the past year but not the past four weeks, or were working fewer hours than they’d like to be scheduled.

Most of those in this expanded measure of labor underutilization were involuntary part-time workers. Between February and May 2020, the number of Oregonians working part-time for economic reasons doubled to 159,700.

Another distinction of the pandemic recession was that, through either federal loans or altered business practices, many Oregon employers were able to keep operating either with fewer workers, or with workers on reduced schedules. Throughout 2020, the number of business establishments overall grew each quarter. Even in leisure and hospitality, the hardest-hit sector that lost half its jobs in spring 2020, the total number of payroll business units remained stable throughout the year. 

Phased re-opening began in Oregon in May, and with it, record-breaking monthly job gains came. Oregon had its largest-ever monthly employment gain in June 2020, adding 52,300 jobs. That momentum was not sustained though; monthly job gains tapered over the summer and into fall Oregon continued to register smaller monthly gains heading into the fall.

As COVID-19 cases also began to rise in the fall, Oregon instituted an initial “two week freeze” that included additional health and safety measures. Subsequent limitations on economic activity to prevent community spread of the disease by county and COVID-19 risk category continued through the rest of 2020 and into 2021.

In December 2020, Oregon lost 27,500 jobs over the month. Absent the pandemic, that December loss would have represented the biggest monthly job decline in Oregon since at least 1990.

In the wake of lower COVID-19 case counts and accelerated vaccine rollout, more areas of the state have moved out of extreme COVID risk categories, and job gains have resumed. Total nonfarm payrolls in Oregon added a combined 20,900 jobs in January and February 2021. The latest forecast from the Office of Economic Analysis predicts stronger growth in 2021 and 2022 than Oregon has seen in decades, and a return to pre-pandemic employment in early 2023. 

Many more details are available in the full year in review article.

Tuesday, March 30, 2021

February 2021 Employment and Unemployment in Oregon’s Counties

In February 2021, 25 out of 36 of Oregon’s counties experienced over-the-month decreases in their unemployment rates. Tillamook and Lincoln counties saw the largest over-the-month decrease, declining 0.5 percentage point each in February.

Clatsop County had Oregon’s highest seasonally adjusted unemployment rate in February at 8.1%. Other counties with some of the highest unemployment rates included Lincoln (8.0%), Crook (8.0%), Curry (7.1%), and Union (7.1%).

Wheeler County registered the lowest unemployment rate for the month at 3.7%. Other counties with some of the lowest unemployment rates in February were Sherman (4.1%), Malheur (4.5%), and Lake (4.5%). Nineteen counties had unemployment rates at or below the statewide rate of 6.1%. Twenty counties also had unemployment rates at or below the nationwide rate of 6.2%.
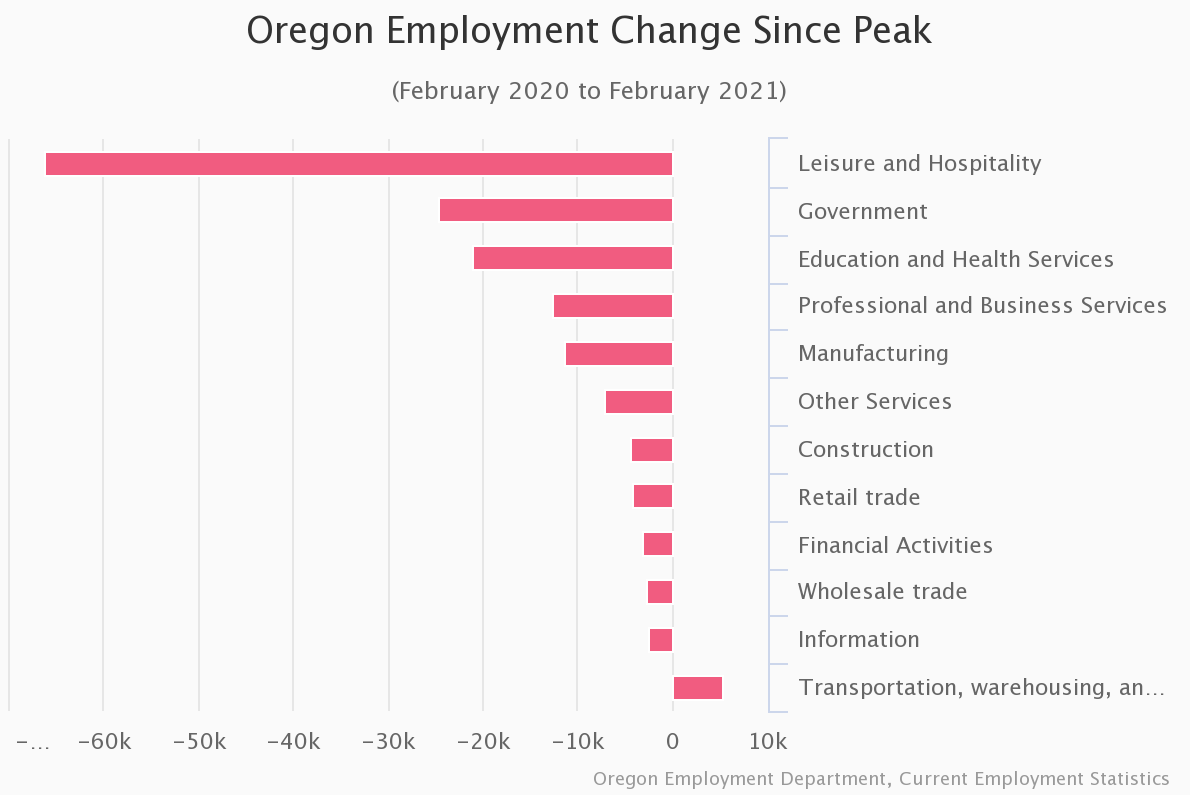
Total nonfarm payroll employment declined in all six of Oregon’s broad regions between February 2020 and February 2021. The largest job losses occurred in the Portland-5 (-9.6%). The Coast (-7.8%), the Willamette Valley (-7.4%), and Central Oregon (-5.5%) also experienced large over-the-year employment losses. Southern Oregon and Eastern Oregon came in at -4.6% and -2.9%, respectively.
Next News Releases

The Oregon Employment Department will release statewide unemployment rate and industry employment data for March 2021 on Tuesday, April 13, 2021. The March 2021 county and metropolitan area unemployment rates will be released on Tuesday, April 20, 2021.

Read the original press release here. 

Wednesday, March 17, 2021

Top Occupations Employers Were Hiring in 2020: Changes in a Pandemic Year

The total estimate of job vacancies at any given time in 2020 dropped 22% from the level in 2019, as the pandemic shuttered businesses and stalled hiring, especially in the spring at the onset of business restrictions. Still, employers were hiring for a wide variety of jobs in 2020; they reported vacancies across 357 different occupations.

Occupations with the highest number of job vacancies in 2020 reflected the necessity of jobs that relate to the pandemic and the changing business practices associated with it. They included heavy truck drivers (1,800); nursing assistants (1,400); personal care aides (1,400); retail salespersons (1,300); stockers and order fillers (1,100); production workers (1,000); fast food and counter workers (1,000); and cashiers (1,000).

While overall hiring demand dropped in 2020, most job vacancies continued to be for full-time, permanent jobs. The only top occupation hiring for mostly part-time jobs was fast food and counter workers, with just 11% of vacancies reported as full-time openings. Among retail salesperson vacancies, two out of three were full-time. Employers were looking to permanently fill jobs with remarkable consistency – among most occupations nine out of 10 openings were permanent. Landscaping and groundskeeping workers had the lowest share of permanent jobs among these top occupations, at 78%.

For about half of 2020 job vacancies, employers reported they had difficulty filling the job. Employers seemed to experience more difficulty in 2020 when hiring for jobs that require a particular type of training beyond high school, like for truck drivers and nursing assistants. Employers didn’t have much difficulty filling the many jobs that opened up to stock store shelves and fill orders, and to serve customers in fast food establishments.

Read the full article by economist Jessica Nelson here

Tuesday, March 16, 2021

Oregon Adds 13,900 Jobs in February

Oregon’s unemployment rate edged down to 6.1% in February, from 6.2% in January. After dropping rapidly during May through November of last year, Oregon’s unemployment rate declined at a slower pace in recent months. During the past 10 months the pace of recovery in the national unemployment rate has mirrored Oregon’s experience. The U.S. unemployment rate also declined by a tenth of a percentage point last month, to 6.2% in February, from 6.3% in January. 


Nonfarm payroll employment rose 13,900 jobs in February, following a gain of 7,000, as revised, in January. Nearly all of the jobs gained in February were in leisure and hospitality (+11,100 jobs), where some fitness centers and restaurants hired back workers following closures or curtailments due to COVID-19 restrictions or cautions. Only two other major industries added a substantial number of jobs in February: transportation, warehousing, and utilities (+1,200 jobs) and wholesale trade (+800). Only one major industry —  professional and business services, which cut 900 jobs in February —  performed substantially below its normal seasonal trend.

In February, Oregon’s nonfarm payroll employment totaled 1,819,100, a drop of 153,900 jobs, or 7.8% from the pre-recession peak one year ago in February 2020. Oregon’s employment dropped to a low of 1,687,500 by April. Since then, Oregon has recovered 131,600 jobs, or 46% of the jobs lost between February and April 2020.


More details about Oregon's February employment situation can be found in the full news release and video summary.


Tuesday, March 9, 2021

January 2021 Employment and Unemployment in Oregon’s Counties

In January 2021, 16 out of 36 of Oregon’s counties experienced over-the-month increases in their unemployment rates. Oregon’s unemployment rate decreased by 0.1 percentage point between December and January, and 14 of Oregon’s counties followed the state with a decline of 0.1 percentage point or more. Deschutes and Grant counties saw the largest over-the-month decrease, declining 0.6 percentage point in January.

Lincoln and Clatsop counties had Oregon’s highest seasonally adjusted unemployment rates in January at 8.1% each. Other counties with some of the highest unemployment rates included Crook (7.8%), Curry (7.3%), and Multnomah (7.2%).

Wheeler County registered the lowest unemployment rate for the month at 4.2%. Other counties with some of the lowest unemployment rates in January were Malheur (4.3%) and Sherman (4.3%). Twenty-two counties had unemployment rates at or below the statewide rate of 6.2%. The same number of counties also had unemployment rates at or below the nationwide rate of 6.3%.

Total nonfarm payroll employment declined in all six of Oregon’s broad regions between January 2020 and January 2021. The largest job losses occurred in the Portland-5 (-9.3%). The Willamette Valley (- 7.5%), the Coast (-7.4%), and Central Oregon (-6.0%) also experienced large over-the-year employment losses. Southern Oregon and Eastern Oregon came in at -3.2% and -2.2%, respectively.

Next News Releases 

The Oregon Employment Department will release statewide unemployment rate and industry employment data for February 2021 on Tuesday, March 16, 2021. The February 2021 county and metropolitan area unemployment rates will be released on Tuesday, March 30, 2021.

Read the original press release here.

Oregon Adds 8,300 Jobs in January

Oregon’s unemployment rate edged down to 6.2% in January from 6.3%, as revised, in December. The state’s unemployment rate dropped by close to four tenths of a percentage point in each of the last three months of 2020, following more rapid declines during the prior five months. Oregon’s peak unemployment rate, as recently revised, was 13.2% in April 2020. The U.S. unemployment rate has also dropped rapidly since April, and reached 6.3% in January. 

Nonfarm payroll employment rose 8,300 jobs in January, following a loss of 27,500 in December. Three industries each added close to 2,000 jobs in January: retail trade (+2,100 jobs); leisure and hospitality (+2,100); and private educational services (+1,900). Two of the major industries cut about 1,000 jobs: transportation, warehousing, and utilities (-1,000 jobs) and construction (-800). 

Despite the net job gain in January, employment still remains substantially below pre-pandemic levels. Total nonfarm payroll employment has dropped 162,800 jobs, or 8.3%, since January 2020. Nearly all industries have cut jobs during that time. Leisure and hospitality is still down 76,800 jobs, or 35.6%, since January 2020. Private educational services experienced the second largest percentage decline in that time, as it cut 8,400 jobs, or 22.6%. The only industry to add jobs in the past 12 months was transportation, warehousing and utilities, which added 4,100 jobs, or 5.6%. 


More details about Oregon's December employment situation can be found in the full news release and video summary.


Monday, March 8, 2021

Did Oregon’s Residential Real Estate Market Become More Affordable in the Pandemic?

Even before the onset of COVID-19 the fast growth in home prices over the past five years had many across the state concerned about housing affordability. In an unexpected turn we have seen a large increase in the demand for housing during this pandemic recession. The high demand has led to historically low inventories of residential real estate for many communities across the state. High demand and low inventory is leading to dramatic home price appreciation, further increasing concerns around housing affordability.

I developed a housing affordability index that looks at the monthly mortgage of the average house as a share of the average wage in a particular geography. Across the state, the average monthly mortgage at the end of 2020 was roughly 26% of the average monthly wage, a considerable decline from 29% the same time last year.


Affordability varies quite dramatically across the state. The least affordable of the communities highlighted was Hood River, where the average monthly mortgage accounted for 44% of the average monthly wage. The lack of affordability in places like Hood River or Bend are twofold. First, the average monthly wage of workers employed locally is lower than the statewide average, in Hood River’s case by more than $1,300 a month. Second, the average monthly mortgage was around $320 higher than the state. Bend also ranked poorly in housing affordability; the average monthly mortgage was around 35% of the average monthly wage. Surprisingly, the Portland Metro Area (Washington Co.) was generally more affordable than the state as a whole due to higher wages that helped to balance the relatively high housing costs. The Salem metro area also ranked relatively high on affordability, where the average mortgage was only around 24% of the average monthly wage.

A time-series of this housing affordability measure shows that concerns about affordability may be overstated. The low cost of borrowing alongside strong wage gains the past several years helped to counter, but not completely overcome, the growth in housing prices. Despite the fact that home prices are near or exceeding the peak from the last expansion, affordability remains notably higher than back in the mid-2000s for every community highlighted. In fact, the last year showed a trend towards the real estate market becoming more affordable, which is likely surprising to anyone who may be looking for a house today.

Low Interest Rates Drive Improvement in Affordability

The dramatic increase in the average wage over the past nine months is misleading as the average is rising due to the loss of low-wage jobs rather than real substantive wage gains. The reported 2020 wages were thrown out and wages were modeled using a three-year trend to check whether housing affordability was being held in check by the artificially high wage increases during the pandemic or by historically low interest rates. Did housing affordability change when modeling a lower average wage? Not much. In fact, housing still moved towards being more affordable even when dropping the average wage to something more consistent with what we likely would have seen had COVID not happened. The real driver in affordability today is interest rates. These historic low interest rates have held the dramatic increase in house prices largely in check. The average worker who buys the average house with today’s interest rates will spend a slightly smaller share of their income on that mortgage than they would have this time last year.

We all live in the real world and housing affordability is more complex than this simplified index. More expensive housing means buyers need a larger down payment. If you were saving to get a 20% down payment on your first house and you were looking at a $350,000 house you would need $70,000 saved. If you lived in someplace like the Bend metro area where home prices have risen more than 10% in the past year that $350,000 house would now likely cost around $390,000. That means your down payment now needs to be $78,000 to get to 20% and avoid mortgage insurance. Most people are not seeing wages increase fast enough to keep pace with these housing prices, which means they are falling behind on their savings goals. However, federal stimulus likely helped many prospective first-time buyers boost their savings.

Finally, this pandemic recession has not been an equal opportunity offender. Job losses have disproportionally impacted lower-wage workers. Due to high demand and low supply the more affordable homes in most markets have seen the largest price increases over the past year. The barrier to entry for first-time buyers is high and remains a distinct challenge for many Oregonians. The good news is that the combination of an increasing pace of new housing construction and a return to a more normal level of geographic mobility should lead to an increased supply of housing as we move further into 2021.

To learn more, read Regional Economist Damon Runberg's full article here


Thursday, March 4, 2021

Oregon's Child Care Industry

Many working parents in Oregon rely on the child care industry for safe, affordable, and educational care for their children. Even with the 2020 spike and still elevated level in unemployment, most parents are in the labor force and employed, translating into a lot of children needing child care. The importance of the industry has been highlighted in the pandemic recession, as child care centers and providers faced new restrictions and risks of providing care in Oregon communities.

The child care sector was hard hit at the onset of the pandemic recession and heavily affected by the restrictions put in place to stop the spread of COVID-19. Due to the nature of such a close-contact business as caring for children, and additionally to the many changes we all dealt with in the spring that suddenly shifted both demand for and supply of child care, employers had to shift rapidly in the spring to reopen with new safety precautions and limitations to group sizes, cohorts, and a new, much smaller, staffing footprint.
 
At the onset of COVID-19, the private-sector child care industry dropped 35% of its jobs in the space of one month, moving from near peak employment of about 13,000 jobs in March to 8,400 jobs in April. As of September, the most recent month of available data, Oregon’s child care businesses had regained just 1,300 of the jobs lost this spring, reaching about 9,700 jobs.

The number of businesses didn’t change much between the first and third quarters of the year, dropping from 1,417 to 1,392. So far, with data through September, almost all child care businesses had survived the pandemic. With COVID-related restrictions lasting well into 2021, it remains to be seen whether more widespread business closures will take place, and how that will affect local child care marketplaces as the economy recovers from the pandemic.

Child care businesses tend to be small operations. In 2018, Oregon’s private-sector child care businesses numbered 1,308 and employed 12,453 workers. Half of the businesses had four or fewer employees. Fifteen percent of child care businesses employ 20 or more workers.

Average wages are low in the industry. Total payroll of child care businesses with employees in 2019 was about $301 million – this averages out to almost $24,000 per worker, less than half the private-sector average of $54,000. The low average wage is due to the low wages of the occupations that dominate the industry. For example, the median wage of a preschool teacher in Oregon in 2020 is $14.71 per hour, and the median wage for childcare workers is $12.90. These two occupations account for more than two-thirds of the employment in the day care industry.

The pandemic recession has harmed the industry a great deal, and its implications for business survival and retention of the child care workforce are still developing as we struggle to get COVID-19 under control. In addition, lower wages tend to be associated with higher turnover, and turnover among regulated child care facilities far exceeds turnover at other educational entities such as K-12 schools. 

Families and businesses rely on a stable child care industry. Increasing availability and affordability of reliable child care options will be necessary to getting Oregonians back to work in the economic recovery after the pandemic. You can read more about Oregon's child care industry in the full article written by Employment Economist Jessica Nelson.

Monday, March 1, 2021

Characteristics of Job Vacancies in 2020

Employers reported 44,400 job openings at any given time in 2020. This is a decrease of 22% from the 2019 level of vacancies. 2020 was not a typical year for Oregon businesses, yet many of the characteristics Oregon employers were looking for didn’t change much during the pandemic recession. A typical job vacancy tends to be for a full-time, permanent position. About one-third require education beyond high school and half require previous experience.

Starting in spring 2020, employers were asked “Is this location closed or operations curtailed due to COVID-19 restrictions?” Nearly one out of five (18%) responses indicated a closure or curtailment in spring 2020. The share dropped to 7% in summer 2020 and 6% in fall 2020. The leisure and hospitality and other services industries most often responded that operations were affected. Employers in the Portland-Metro and Northwest Oregon areas reported the highest shares of affected businesses.

In 2020, health care and social assistance reported the most vacancies of any industry (9,000), followed by management, administrative, and waste services (5,800), and leisure and hospitality (4,900). Together these three sectors accounted for 44% of all job openings statewide. Hiring demand was spread across the economy. Except for private educational services and information, all industries reported at least 1,000 job vacancies at any given time in the year.

As education requirements rose, so did the average starting wage for job openings. Job vacancies with no education requirement averaged $14.26 per hour in 2020. That rose to $15.59 for job vacancies requiring a high school diploma. Employers offered an average of $24.75 per hour for jobs with either some college, an associate degree, or a special certification beyond high school. Vacancies with bachelor’s or advanced degree requirements paid even more per hour, averaging $28.24. Shares of job vacancies requiring previous experience also rose along with education requirements. 

During the COVID-19 pandemic, employers continued to hire across Oregon’s economy in 2020. Most job vacancies offered full-time work schedules, and employers were mostly looking to fill permanent positions. Vacancies with higher education requirements also came along with a greater likelihood for prior experience requirements, and higher average wages.

Read the full article written by senior economic analyst Anna Johnson here. More information about regional and statewide job vacancies can be found in the Job Vacancy Survey box on the publications page of QualityInfo.org.


Thursday, February 18, 2021

African Americans in Oregon: A Labor Market Perspective

According to the Oregon Encyclopedia, “Oregon's racial makeup has been shaped by three black exclusion laws that were in place during much of the region's early history. These laws, all later rescinded, largely succeeded in their aim of discouraging free blacks from settling in Oregon early on, ensuring that Oregon would develop as primarily white.” 

Though only a small share of the state’s population, Oregon’s Black population is diverse, young, and has grown quickly over the last 10 years. Black Oregonians have achieved higher levels of educational attainment over the past decade and have experienced better economic outcomes including higher labor force participation, lower unemployment rates, and higher earnings. However, large disparities in labor market outcomes between Black people and all in Oregon persist and may worsen in the short term during the COVID-19 pandemic recession, as research from the Federal Reserve Bank of San Francisco shows that relative labor market outcomes for Black people improve under tight labor market conditions and worsen during recessions. Here, we will take a look at relative employment outcomes for Oregon's Black residents over the past decade from 2010 to 2019. 

Labor Market Outcomes

The Black population’s labor force participation rate has increased to become higher than for the state’s overall population, driven in part by increased levels of educational attainment in the Black community and overall improving labor market conditions. However, Black Oregonians continue to suffer from a significantly higher unemployment rate at 9.0% compared to 5.5% for all in Oregon’s labor force on average from 2015 to 2019.

Achieving higher levels of educational attainment may help Black people improve their individual employment outcomes, but national data show that Black people still face unemployment rates nearly twice as high compared with all in the labor force across all levels of educational attainment.

Along with improving educational attainment, unemployment and labor force participation rates, real average annual wages for Black workers in Oregon have increased by 18.1% over the decade to $47,500 in 2019. The rate of growth has been faster than the 14.6% wage growth that was experienced across all workers during this period. Nevertheless, average annual earnings for Black workers were 15.0% lower (or $8,412) than earnings for all workers as of 2019.


Wage gaps between Black workers and all others are persistent across all levels of educational attainment for full-time, year-round workers over the age of 25. The largest wage gap occurs at the highest end of the educational attainment spectrum, with Black workers in Oregon with advanced or professional degrees earning median wages roughly $12,000 less than their equally educated peers from 2015 to 2019. Black workers with some college or an associate degree statewide earned essentially the same median wage ($37,000) as workers of all others combined with a high school diploma or equivalent ($40,000). Oregon’s broad trends are consistent with national-level data, with the Black workers earning lower median annual wages ranging from $2,700 less for those with less than a high school diploma to $17,000 less for those with an advanced or professional degree compared with all other workers with the same levels of educational attainment nationally.


Wages consistently increase along with educational attainment for both groups of workers nationally and statewide. Black workers in Oregon with some college or an associate degree, a bachelor’s degree, and an advanced or professional degree earned a median wage of $37,000, $56,000, and $68,000 respectively from 2015 to 2019. Median annual wages were $19,000 (51%) higher for Black workers with a bachelor’s degree compared to those with some college or an associate degree.

Factors like age, gender, and occupation are hard to control for in Oregon due to sample size limitations that affect data reliability, but national data show that none of these factors can completely explain why an earnings gap exists. The Federal Reserve Bank of Minneapolis explains in a study of their own labor market that, “Unequal labor market outcomes are not a consequence of the labor market alone but also reflect the institutionalization of systemic racism through less opportunity in education, housing, location, and the criminal justice system.”

Eradicating economic disparities between marginalized groups of people will increase the U.S.’s overall economic output and improve the lives of individuals and familiesTo keep moving forward towards better economic outcomes, a combination of individual and policy-level efforts are necessary. Individuals can increase their earnings and decrease their likelihood of becoming unemployed through education and training efforts. Key federal agencies such as the Federal Reserve Bank of America can act in ways that promote economic recovery and expansion for longer periods of time, and state and local government can ensure their policies are inclusive of everyone in their communities. Businesses also have a role to play by examining and improving their policies related to the hiring, retention, and promotion of workers. 

To learn more, read economist Sarah Cunningham's article here.

Wednesday, February 17, 2021

Multi-Modal: Transportation and Warehousing in Oregon

The transportation and warehousing sector includes many modes of travel, in addition to the mail and deliveries that come to our doors. During the pandemic recession, years of gains in some types of transportation were reversed, as staying home became the norm. At the same time, the pandemic intensified what was already an increasing reliance on deliveries and the distribution system that gets them to us. As a result, this broad sector’s employment is surging, in stark contrast to the slow overall employment recovery from the pandemic recession.

By Air
Not all portions of transportation and warehousing have seen their employment soar. After adding nearly 1,700 jobs between 2013 and 2019, air transportation lost 600 (-11%) jobs through the first three quarters of 2020. The airlines classified in this subsector have struggled through the pandemic. Similarly, support services for transportation -- which includes airports -- declined by 9% between 2019 and the first three quarters of 2020.

Over the Road
For now, truck transportation remains the largest piece of the overall transportation and warehousing sector. Its employment has seen little change in recent years, but did decline by 3% to an average of 18,400 jobs between 2019 and the first three quarters of 2020.

By comparison, the transit and ground transportation subsector saw much more job movement over the years. After growing from 9,900 jobs to 12,300 (24%) between 2009 and 2019, transit and ground transportation fell to an average of 10,600 jobs (-13%) in the first three quarters of 2020.

While there was undoubtedly decline in these operations due to reduced travel, the available data can’t fully represent the trends in this industry. That’s because ride-hailing and gig-type food delivery services are not included in covered employment statistics. The nonemployer statistics related to transit and ground passenger transportation show an increase of 10,000 (or 774%) from 2009 to 2018. Nearly all that growth occurred in taxi and limousine services.

More to Your Door
Two subsectors of transportation and warehousing carry correspondence, care packages, and other deliveries door to door: couriers and messengers, and the postal service. For years, the private couriers and messengers subsector has shown a distinctive and increasing seasonal pattern. They tend to ramp up hiring in the fourth quarter, hitting an employment peak each December.

In addition to more December deliveries, couriers and messengers businesses have also been hiring to meet greater demand for online shopping and deliveries to our doors year round. From 2009 to 2019, annual average employment grew by 4,300 jobs, or 69%. The global pandemic intensified this trend. Fleets of big brown trucks, gray vans, local grocers, and their counterparts collectively added 1,500 jobs (14%) between 2019 and the first three quarters of 2020.

Warehousing and Storage
While the gray vans, brown trucks, and mail carriers give visuals in the neighborhood, they’re fueled by rapid growth in the warehousing and storage subsector. Just between 2018 and the first three quarters of 2020, employment grew by 8,200 jobs to 18,100. That’s an 82% increase and does not yet include the peak holiday delivery season for 2020. While the big, public announcements of new Amazon operations play a role here, big box stores with warehousing and storage operations have grown recently too.

Given the continued growth of e-commerce, particularly during the holidays, and the expanding presence of Amazon in Oregon and elsewhere, the 2019 to 2029 growth outlook for both couriers and messengers (22%) and warehousing and storage (27%) is strong. By comparison, Oregon’s anticipated total employment growth will be 9%.  

More information about Oregon's transportation and warehousing industry can be found in the full article.