Pages

Showing posts with label Southern Oregon. Show all posts

Thursday, November 5, 2020

Payroll Employment for Businesses Destroyed in Almeda Fire

Within the level 3 evacuation zone in Jackson County, the Almeda fire burned though the core business route of Hwy. 99 from the edge of Ashland to the outskirts of Medford. In some spots the wind-whipped fire devastated all businesses on both the east and west sides of the highway, at other times hopscotching its way south, indiscriminately taking out some businesses while sparing others seemingly without explanation. For the ground level look, you can search any property within the fire perimeter now and see what is there now.

Using a few sources such as a Google map showing the fire outline and a published list businesses lost in the fire that appeared on a local news website, there are about 130 businesses that have been lost due to the fire. More will be incorporated as a city business license list is added to these other sources. These lists include both self-employed and sole proprietors, those businesses who don’t have any paid employees, as well as businesses with “covered” employment (jobs covered by unemployment insurance). 

Within those 130 or more total businesses that were destroyed or heavily damaged in the fire, we have payroll employment and wage data for 63 of those businesses that were in operation during the third quarter of 2019. While we don’t know of course how many workers those businesses had during the third quarter of 2020 when the fire struck, looking back at last year’s figures can give us a sense of the likely overall payroll employment impact.

During the summer quarter of 2019, there were about 510 payroll jobs among the 63 establishments that were lost in the fire. These businesses had $4,177,786 in total payroll, with an average annual wage per job of $32,703. All of the jobs lost were in the private sector. Not included in the total was the Southern Oregon Education Service District campus, as it is unclear how many of those jobs were dependent on that location or could be done remotely or at other locations. That’s also important to note for other businesses – we don’t know how many jobs within businesses that were lost could be relocated to their other business operations, temporary locations, or are simply gone until we see which businesses are rebuilt or relocated. The 510 payroll jobs represented 0.6 percent of Jackson County’s total payroll employment and 0.4 percent of total payroll during the summer of 2019.


Looking at the mix of jobs by industry affected by the Almeda Fire, we see a similar distribution of jobs as the overall economy, with leisure and hospitality, retail trade, and health care and social assistance accounting for most jobs. There is not very much industry detail available due to confidentiality.

For all of these businesses, sole proprietors, and self-employed workers, a few resources are being added to the new Rogue business website under the “Wildfire Resources Available” banner: http://roguebusiness.org/.

Jackson County has launched a website for official wildfire recovery information: RogueValleyRebuilds.org. It is aimed at those affected by the Almeda and Obenchain fires and brings together information from multiple organizations involved in the rebuilding effort.

For more information, read Regional Economist Guy Tauer's full article here.

Tuesday, March 10, 2020

January Employment and Unemployment in Oregon’s Counties

Benton County had Oregon’s lowest seasonally adjusted unemployment rate at 2.8 percent in January 2020. Other counties with some of the lowest unemployment rates in January include Washington (2.9%), Hood River (3.0%), and Multnomah (3.1%). Six counties had unemployment rates below the national rate of 3.6 percent. The same six counties also had unemployment rates at or below the statewide rate of 3.3 percent.

Grant County registered the highest unemployment rate for the month at 6.3 percent. Other counties with some of the highest unemployment rates in January were Klamath (6.2%) and Wallowa (5.5%).

In January 2020, all of Oregon’s counties were at or below their unemployment rates for January 2019. Sherman County had the same unemployment rate in January 2020 as in January 2019 (4.0%). Harney County’s unemployment rate decreased the most, dropping 1.9 percentage points from 6.6 percent in January 2019 to 4.7 percent in January 2020.

Total nonfarm payroll employment rose in four of Oregon’s six broad regions between January 2019 and January 2020. The largest job gains occurred in the Portland area (+1.1%). The Willamette Valley (+0.9%), Central Oregon (+0.7%), and Southern Oregon (+0.2%) saw employment growth over the past year.

Read the full press release here.

Tuesday, January 28, 2020

December 2019 Employment and Unemployment in Oregon’s Counties

Benton and Washington County had Oregon’s lowest seasonally adjusted unemployment rates at 3.0 percent in December 2019. Other counties with some of the lowest unemployment rates in December included Hood River (3.1%) and Multnomah (3.2%). Seven counties had unemployment rates below the national rate of 3.5 percent. Nine of Oregon’s counties had unemployment rates at or below the statewide rate of 3.7 percent.

Grant County registered the highest unemployment rate for the month at 6.6 percent. Other counties with some of the highest unemployment rates in November were Klamath (6.3%) and Wallowa (5.9%).

In December 2019, all of Oregon’s counties were at or below their unemployment rates for December 2018. Wheeler County had the same unemployment rate in December 2018 as in December 2019 (4.5%). Curry County’s unemployment decreased the most, from 6.8 percent in December 2018 to 5.1 percent in December 2019.


Total nonfarm payroll employment rose in all six of Oregon’s broad regions between December 2018 and December 2019. The largest job gains occurred in Central Oregon (+2.2%). The Portland area (+1.0%), Southern Oregon (+1.0%), the Willamette Valley (+0.8%), the Coast (+0.7%), and Eastern Oregon (+0.6%) also saw employment growth over the past year.

Read the full press release here.

Tuesday, December 24, 2019

November 2019 Employment and Unemployment in Oregon’s Counties

Benton County had Oregon’s lowest seasonally adjusted unemployment rate at 3.1 percent in November 2019. Other counties with some of the lowest unemployment rates in November included Washington (3.2%), Hood River (3.3%), and Multnomah (3.4%). These four counties had unemployment rates below the national rate of 3.5 percent. Nine of Oregon’s counties had unemployment rates at or below the statewide rate of 3.9 percent.
Total nonfarm payroll employment rose in all six of Oregon’s broad regions between November 2018 and November 2019. The largest job gains occurred in Central Oregon (+2.5%). Southern Oregon (+1.7%), the Portland area (+1.0%), the Coast (+0.7%), Eastern Oregon (+0.6%), and the Willamette Valley (+0.6%) saw employment growth over the past year.

Read the full press release here

Tuesday, October 22, 2019

September 2019 Employment and Unemployment in Oregon’s Counties

Benton County had Oregon’s lowest seasonally adjusted unemployment rate at 3.3 percent in September 2019. Other counties with some of the lowest unemployment rates in September included Hood River (3.4%), Washington (3.4%), and Multnomah (3.6%). Three counties had unemployment rates at or below the national rate of 3.5 percent. Nine of Oregon’s counties had unemployment rates below the statewide rate of 4.1 percent. Grant County registered the highest unemployment rate for the month at 7.1 percent. Other counties with some of the highest unemployment rates in September were Klamath (6.7%) and Wallowa (6.6%).
Total nonfarm payroll employment rose in all six of Oregon’s broad regions between September 2018 and September 2019. The largest job gains occurred in the Portland area (+1.1%). The Coast (+0.8%), Southern Oregon (+0.8%), the Willamette Valley (+0.7%), Central Oregon (+0. 6%), and Eastern Oregon (+0.4%) also saw employment growth over the past year.
Read the full press release here

Tuesday, September 24, 2019

August 2019 Employment and Unemployment in Oregon’s Counties

Benton County had Oregon’s lowest seasonally adjusted unemployment rate at 3.2 percent in August 2019. Other counties with some of the lowest unemployment rates in August included Hood River (3.4%), Washington (3.4%), and Multnomah (3.5%). Six counties had unemployment rates at or below the national rate of 3.7 percent. Nine of Oregon’s counties had unemployment rates below the statewide rate of 4.0 percent. Grant County registered the highest unemployment rate for the month at 7.1 percent. Other counties with some of the highest unemployment rates in August were Wallowa and Klamath (6.5%).
August 2019 unemployment rates for almost all of Oregon’s counties were similar to what they were in August 2018. Only Wheeler County had a change greater than 1 percentage point, with an increase of 1.2 percentage points in its unemployment rate over the past year. Curry County’s unemployment rate decreased 0.3 percentage point over the past year, the most of any county.

Total nonfarm payroll employment rose in all six of Oregon’s broad regions between August 2018 and August 2019. The largest job gains occurred in the Portland area and Southern Oregon (+1.2%). The Willamette Valley (+0.9%), the Coast (+0.8%), Central Oregon (+0.3%), and Eastern Oregon (+0.3%) also saw employment growth over the past year.
The press release can be found here

Tuesday, August 20, 2019

July 2019 Employment and Unemployment in Oregon’s Counties

Benton County had Oregon’s lowest seasonally adjusted unemployment rate at 3.1 percent in July 2019. Other counties with some of the lowest unemployment rates in June included Washington (3.3%), Hood River (3.4%), and Multnomah (3.5%). Seven counties had unemployment rates at or below the national rate of 3.7 percent. Eight of Oregon’s counties had unemployment rates below the statewide rate of 4.0 percent. 

Grant County registered the highest unemployment rate for the month at 7.3 percent. Other counties with some of the highest unemployment rates in July were Wallowa and Klamath (6.4%). July 2019 unemployment rates for almost all of Oregon’s counties were similar to what they were in July 2018. 
Total nonfarm payroll employment rose in all six of Oregon’s broad regions between July 2018 and July 2019. The largest job gains occurred in the Portland area (+1.5%). Southern Oregon (+1.1%), the Willamette Valley (0.9%), the Coast (+0.8%), Eastern Oregon (+0.8%), and Central Oregon (+0.4%) also saw employment growth over the past year.

Read the full press release here

Tuesday, July 23, 2019

June 2019 Employment and Unemployment in Oregon’s Counties

Benton County had Oregon’s lowest seasonally adjusted unemployment rate at 3.2 percent in June 2019. Other counties with some of the lowest unemployment rates in June included Washington (3.3%), Hood River (3.5%), and Multnomah (3.5%). Seven counties had unemployment rates at or below the national rate of 3.7 percent. Eight of Oregon’s counties had unemployment rates below the statewide rate of 4.1 percent.

Grant County registered the highest unemployment rate for the month at 7.5 percent. Other counties with some of the highest unemployment rates in June were Klamath (6.5%) and Wallowa (6.3%).
Read the full press release here.

Tuesday, June 25, 2019

May 2019 Employment and Unemployment in Oregon’s Counties

Benton County had Oregon’s lowest seasonally adjusted unemployment rate at 3.2 percent in May 2019. Other counties with some of the lowest unemployment rates in May included Washington (3.4%) and Hood River (3.5%). Only Benton, Washington, Hood River, and Multnomah counties had unemployment rates at or below the national rate of 3.6 percent. Eight of Oregon’s counties had unemployment rates below the statewide rate of 4.2 percent.

Grant County registered the highest unemployment rate for the month at 7.8 percent. Other counties with some of the highest unemployment rates in May were Klamath (6.7%); and Wallowa, Lake, and Harney (6.3%). May 2019 unemployment rates for almost all of Oregon’s counties were similar to what they were in May 2018. Only Wheeler (+1.5%), Grant (+1.1%), and Gilliam (+1.0%) counties had unemployment rates change more than 1 percentage point over the past year.
Read the full press release here

Tuesday, May 21, 2019

April 2019 Employment and Unemployment in Oregon’s Counties

Benton County had Oregon’s lowest seasonally adjusted unemployment rate at 3.3 percent in April 2019. Other counties with some of the lowest unemployment rates in April included Washington (3.5%) and Hood River (3.6%). Only Benton, Washington, and Hood River counties had unemployment rates at or below the national rate of 3.6 percent. Eight of Oregon’s counties had unemployment rates below the statewide rate of 4.3 percent. 

Grant County registered the highest unemployment rate for the month at 8.0 percent. Other counties with some of the highest unemployment rates in April were Klamath (6.9%) and Harney (6.6%). April 2019 unemployment rates for almost all of Oregon’s counties were similar to what they were in April 2018. Only Wheeler (+1.5%), Gilliam (+1.1%), Grant (+1.1%), and Lake (+1.1%) counties had unemployment rates change more than 1 percentage point over the past year.
Read the full press release here

Tuesday, April 23, 2019

March 2019 Employment and Unemployment in Oregon’s Counties

Benton County had Oregon’s lowest seasonally adjusted unemployment rate at 3.4 percent in March 2019. Other counties with some of the lowest unemployment rates in March included Washington (3.6%), Clackamas, Hood River, Multnomah, and Yamhill (all at 3.9%). Only Benton and Washington counties had unemployment rates at or below the national rate of 3.8 percent. Seven of Oregon’s counties had unemployment rates below the statewide rate of 4.4 percent.

Grant County registered the highest unemployment rate for the month at 8.4 percent. Other counties with some of the highest unemployment rates in March were Klamath (7.3%) and Harney (6.9%). The March 2019 unemployment rates of almost all of Oregon’s counties were higher than they were in March 2018.
Read the full press release here

Tuesday, March 26, 2019

February 2019 Employment and Unemployment in Oregon’s Counties

Benton County had Oregon’s lowest seasonally adjusted unemployment rate at 3.4 percent in February 2019. Other counties with some of the lowest unemployment rates in February included Washington (3.7%) and Hood River (3.8%). Only these three counties had unemployment rates at or below the national rate of 3.8 percent. Seven of Oregon’s counties had unemployment rates below the statewide rate of 4.4 percent. 

Grant County registered the highest unemployment rate for the month at 8.7 percent. Other counties with some of the highest unemployment rates in February were Klamath (7.4%) and Harney (7.1%).

The February 2019 unemployment rates of all of Oregon’s counties were higher than they were in February 2018. The largest changes from the previous year were in Wheeler (+1.8%), Grant (+1.7%), and Gilliam (+1.6%).

Read the full press release here

Tuesday, March 12, 2019

January 2019 Employment and Unemployment in Oregon’s Counties

Benton County had Oregon’s lowest seasonally adjusted unemployment rate at 3.4 percent in January 2019. Other counties with some of the lowest unemployment rates in January included Hood River (3.5%) and Washington (3.7%). Seven of Oregon’s counties had unemployment rates at or below the statewide unemployment rate of 4.3 percent and the national rate of 4.0 percent.

Grant County registered the highest unemployment rate for the month at 8.5 percent. Other counties with some of the highest unemployment rates in January were Harney and Klamath (7.2%).

Total nonfarm payroll employment rose in all six of Oregon’s broad regions between January 2018 and January 2019. The largest job gains occurred in Southern Oregon and Central Oregon (+1.5%). The Portland Area (+1.2%), the Coast (+0.8%), the Willamette Valley (+0.6%) and Eastern Oregon (+0.6%) also added jobs.

Read the full press release here

Wednesday, January 23, 2019

December 2018 Employment and Unemployment in Oregon’s Counties

Benton County had Oregon’s lowest seasonally adjusted unemployment rate at 3.3 percent in December 2018. Other counties with some of the lowest unemployment rates in December included Hood River (3.5%), Washington (3.5%), and Multnomah (3.7%).

Seven of Oregon’s counties had unemployment rates at or below the statewide unemployment rate of 4.1 percent and six were at or below the national rate of 3.9 percent. Eastern and Southern Oregon had higher unemployment rates in December 2018, which were still close to their record low unemployment rates since 1990.

Grant County registered the highest unemployment rate for the month at 7.4 percent. Other counties with some of the highest unemployment rates in December were Klamath (6.6%) and Curry (6.5%).

Read the full press release here

Thursday, December 27, 2018

November 2018 Employment and Unemployment in Oregon’s Counties

Benton County had Oregon’s lowest seasonally adjusted unemployment rate at 3.3 percent in November 2018. Other counties with some of the lowest unemployment rates in November included Hood River (3.4%), Washington (3.4%), and Multnomah (3.6%). 

Seven of Oregon’s counties had unemployment rates at or below the statewide unemployment rate of 3.9 percent and four were at or below the national rate of 3.7 percent. Eastern and Southern Oregon had higher unemployment rates in November 2018, which were still close to their record low unemployment rates since 1990. 
Grant County registered the highest unemployment rate for the month at 7.1 percent, which was 1 percentage higher than Grant’s lowest unemployment rate since comparable records began in 1990. Harney County’s unemployment rate improved over the year by 0.7 percentage point, more than any other county.

Total nonfarm payroll employment rose in all six of Oregon’s broad regions between November 2017 and November 2018. The largest job gains occurred in Central Oregon (+2.3%). The Willamette Valley (+1.9%), Southern Oregon (+1.4%), the Portland area (+1.3%), the Oregon Coast (+0.8%), and Eastern Oregon (+0.7%) also added jobs.

Press releases for all Oregon areas are available here. 

Tuesday, September 25, 2018

Twenty-Three Counties At Record Low Unemployment Rates in August

Benton County had Oregon’s lowest seasonally adjusted unemployment rate at 2.8 percent in August 2018. Other counties with some of the lowest unemployment rates in August included Hood River (3.0%), Washington (3.1%), and Wheeler (3.1%). Eastern and Southern Oregon had higher unemployment rates in August 2018, which were still close to their record low unemployment rates since 1990. In Oregon, twenty-three counties had record low unemployment rates in August.

Grant County registered the highest unemployment rate for the month at 6.2 percent, which was Grant’s lowest unemployment rate since comparable records began in 1990.
Eleven of Oregon’s counties had unemployment rates below the statewide unemployment rate of 3.8 percent and thirteen were at or below the national rate of 3.9 percent.

Crook and Sherman counties saw their unemployment rates improve over the year by 1.0 percentage point, more than any other county. Other counties that saw their unemployment rate decrease were Gilliam (-0.9%), Jefferson (-0.9%), and Coos (-0.8%). No county saw their unemployment rate increase in August.

Total nonfarm payroll employment rose in all six of Oregon’s broad regions between August 2017 and August 2018. The largest job gains occurred in Central Oregon (+3.1%). Southern Oregon (+2.9%), the Willamette Valley (+2.6%), the Portland area (+1.7%), the Oregon Coast (+1.7%), and Eastern Oregon (0.5%) also added jobs.

Press releases for all Oregon counties are available at www.qualityinfo.org/press-release.

Tuesday, May 22, 2018

April 2018 Employment and Unemployment in Oregon’s Counties

Wheeler County had Oregon’s lowest seasonally adjusted unemployment rate at 3.0 percent in April 2018. Other counties with some of the lowest unemployment rates in April included Benton (3.1%), Gilliam (3.2%), and Hood River (3.2%). Grant County registered the highest unemployment rate for the month at 7.2 percent.

Twelve of Oregon’s counties had unemployment rates at or below the statewide unemployment rate of 4.1 percent. Wheeler County saw its unemployment rate improve over the year by 1.4 percentage points, more than any other county. Klamath County saw its unemployment rate increase the most of any county over the past year, rising 0.5 percentage point to 6.3 percent. 

Total nonfarm payroll employment rose in five of Oregon’s six broad regions between April 2017 and April 2018. The largest job gains occurred in Central Oregon (+2.9%). Southern Oregon (+2.7%), the Willamette Valley (+2.1%), the Portland area (+1.3%), and the Oregon Coast (+1.2%) also added jobs. Eastern Oregon had no growth over the past year.

To learn more about the employment situation for your county, click here. To see the full press release, click here.

Tuesday, April 24, 2018

March 2018 Employment and Unemployment in Oregon’s Counties

Wheeler County had Oregon’s lowest seasonally adjusted unemployment rate at 2.9 percent in March 2018. Other counties with some of the lowest unemployment rates in March included Benton (3.1%) and Hood River (3.2%). 

Eastern and Southern Oregon had higher unemployment rates in March 2018, which were still close to their record low unemployment rates since 1990. Grant County registered the highest unemployment rate for the month at 7.3 percent.

Ten of Oregon’s counties had unemployment rates at or below the statewide and national unemployment rate of 4.1 percent. Wheeler County saw its unemployment rate improve over the year by 1.4 percentage points, more than any other county. Josephine County saw its unemployment rate increase the most of any county over the past year, rising 0.8 percentage point to 5.3 percent.

To learn more about the employment situation for your county, click here. To see the full press release, click here.

Tuesday, March 27, 2018

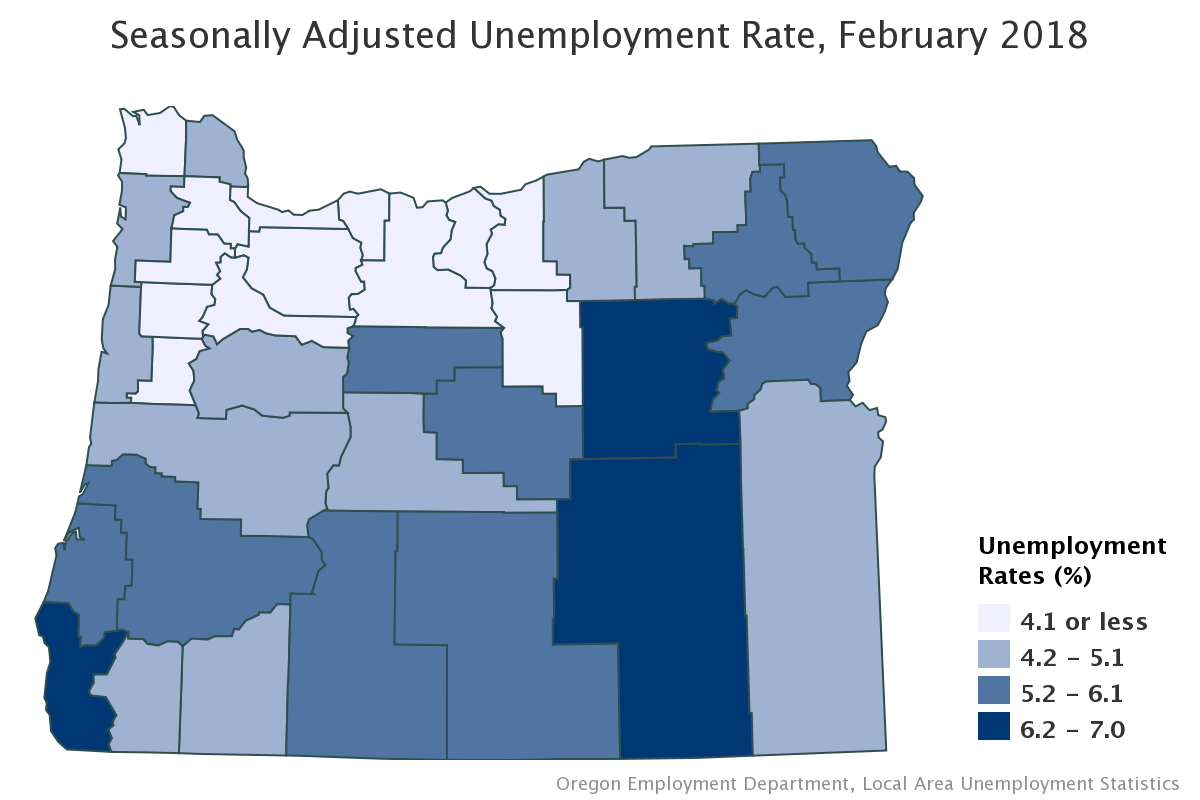
February 2018 Employment and Unemployment in Oregon’s Counties

Wheeler County had Oregon’s lowest seasonally adjusted unemployment rate at 2.8 percent in February 2018. Other counties with some of the lowest unemployment rates in February include Gilliam (2.9%) and Benton (3.1%). Grant County registered the highest unemployment rate for the month at 7.0 percent.

Thirteen of Oregon’s counties had unemployment rates at or below the statewide and national unemployment rate of 4.1 percent. Wheeler County saw its unemployment rate improve over the year by 1.6 percentage points, more than any other county. Deschutes County saw its unemployment rate increase the most of any county over the past year, 0.6 percentage point.

Total nonfarm payroll employment rose in all of Oregon’s six broad regions between February 2017 and February 2018. The largest job gains occurred in Central Oregon (+3.1%). Southern Oregon (+2.5%), the Willamette Valley (+1.8%), the Portland area (+1.6%), and Eastern Oregon (+1.1%) also saw growth. The Oregon Coast saw a slight job gain of 0.2 percent.
To learn more about the employment situation for your county, click here. To see the full press release, click here.

Tuesday, October 31, 2017

Wildfires Impact on September Employment Figures

September’s wildfires didn’t seem to have a noticeable impact on the statewide jobs and unemployment rate report. The fires did have a noticeable impact the local job reports in the Columbia Gorge, Central Oregon, and Southern Oregon. Leisure and hospitality businesses in these areas cut a combined 600 more jobs than they usually do in September. This sector includes restaurants, hotels, and other tourism related businesses. Since the wildfires and smoke coincided with the end of the tourism season, it is not possible to fully tell which jobs were lost due to the
unusual wildfires and smoke, and which jobs were cut as the usual tourism season ended.

The wildfires had no effect on unemployment rates in September. In order to be counted as unemployed in the statistics, an individual must not have a job during the reference week (the week of the month containing the 12th, which was September 10-16, 2017), but were available for a job and were making active efforts to find one. Individuals that have jobs but were temporarily absent from their workplace due to wildfires would be considered employed, as would workers whose normal work hours were reduced during the week.

Seasonal wildland firefighter jobs are often outside the scope of the monthly job growth figures. Figures for the increase in wildland firefighter jobs will be available in about three months.

Employment Department regional economists in Central Oregon, the Columbia Gorge, the Portland area, South Coast, and Southern Oregon provided more detailed information about wildfire employment impacts in their areas, which can be found here.