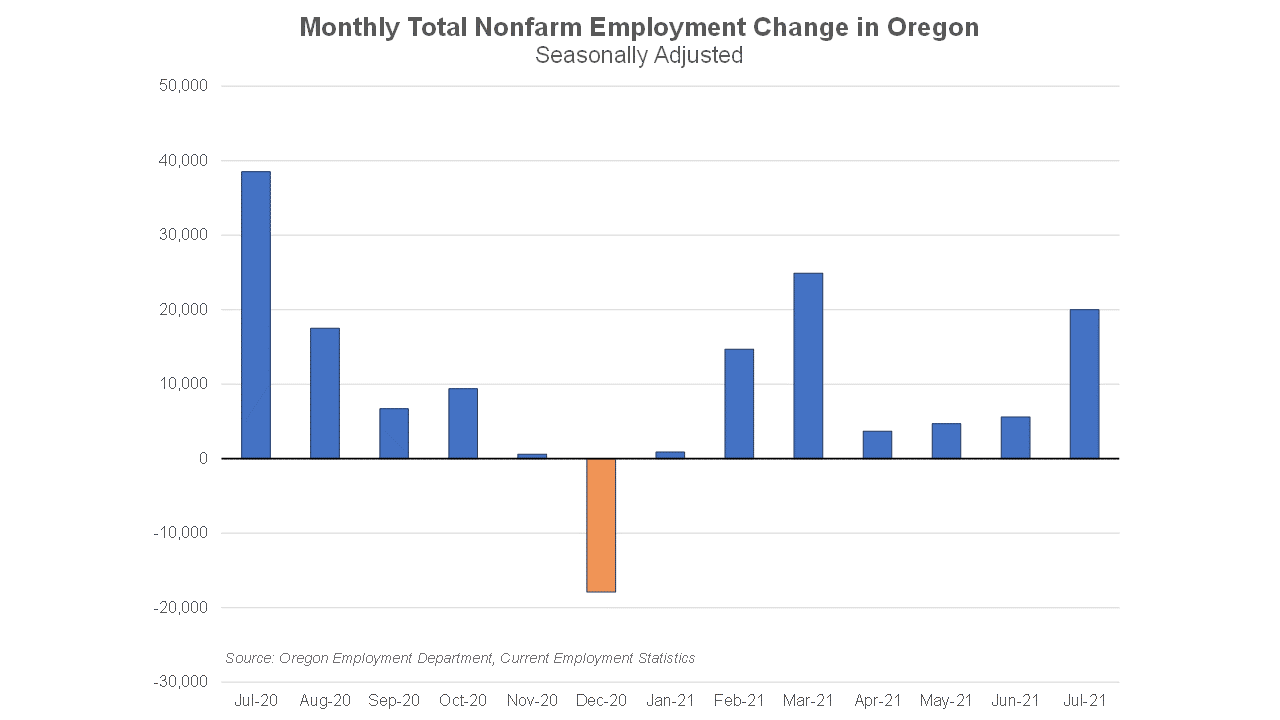
Oregon's jobs recovery strengthened in July. Oregon added 20,000 jobs to nonfarm payrolls, and the unemployment rate dropped significantly to 5.2%.
Leisure and hospitality added 7,100 jobs in July. That means one out of three jobs added over the month was at Oregon's restaurants, hotels, and entertainment places. In the first seven months of 2021, Oregon's leisure and hospitality sector added as many jobs as it did in five years (61 months) leading up to the pandemic.
Government added 12,800 jobs in July. These were related
to public education. School employment was already much lower than
normal in July, and they had fewer layoffs than we'd generally expect
this time of year. When we expect schools to let go of bus drivers and
cafeteria workers for the summer, but there were already not as many
working at schools recently, it can look like a big gain.
Oregon's
unemployment rate improved from 5.6% in June to 5.2% in July. This was a
significant drop that happened because many unemployed people found
jobs over the month. Oregon's unemployment rate hit its all-time peak of
13.2% in April 2020. In the 15 months since then, the rate has fallen
by 8.0 percentage points.
More information about Oregon's employment situation is available in thefull news release, or in the video recap.
This week we've shared the latest unemployment and labor force numbers from June, and job vacancy totals during spring 2021 in Oregon. Oregon's unemployment rate dropped to 5.6% in June. At any given time during spring 2021, Oregon's private employers had 98,000 job openings. This makes for a good opportunity to check in on the Beveridge Curve.
The Beveridge Curve shows the relationship between the job openings rate (vacancies/labor force) and the unemployment rate. Note the labor force includes all those ages 16+ who are either employed, or out of work but are available and able to take a job if offered to them, and have actively sought work in the past four weeks.
At first glance the Beveridge Curve is just a messy squiggle. That squiggly line does generally tend to move in predictable ways though. If it moves out to the right, but stays high, this could mean those who are unemployed are not finding jobs as well, when there seem to be plenty of vacancies. This is where we were in spring 2020.
When the curve moves up and to the left over time, that means the unemployment rate is low, and there's strong hiring demand relative to the size of the labor force. This appears to be the situation we're in now. Hiring demand is strong, like it was at its last peak in summer 2017. Now, both Oregon and the nation have recently hit the highest level of job openings on record, while the unemployment rate is relatively low. The U.S. Beveridge Curve looks much like Oregon's.
What does that mean? In spring 2020, about 9 out of 10 layoffs at the beginning of the pandemic recession were temporary. Those workers probably expected to get called back to work by their employer once businesses could resume operations, and weren't likely seeking another job.
At the
same time, higher-wage earners were more likely to keep their jobs in the downturn, and
most households received direct federal fiscal stimulus. That translated
to people continuing to buy stuff, and a different mix of stuff (e.g.,
home goods rather than vacations). That helped keep up the hiring demand to
make and/or deliver that stuff, even with higher unemployment. Now, the Beveridge Curve and the economic picture look quite different. Oregon's unemployment rate has recovered about five times faster during this recovery than it did following the onset of the Great Recession. We closed many otherwise thriving businesses for public health and safety, to prevent the spread of COVID-19. The first wave of re-opening shows in the dramatic shift of the Beveridge Curve to the left, during what was likely a surge of recalls during the summer and fall of 2020. Unemployment declined significantly, while job vacancies didn't surge relative to the labor force.
After a pause in both aspects of the Beveridge Curve over the winter -- and an economic "freeze" period -- unemployment has continued to decline in 2021.Meanwhile, the number of job vacancies skyrocketed.
What is driving our current, really high point on the curve? As with everything else this year, there are likely many factors at play -- at the same time -- and it's hard to tell just how much to attribute to each one. Here's a (not necessarily exhaustive) list of possibilities:
There are still some people sitting out the labor force due to COVID-19 concerns. While this has eased from 45,000 in the winter of 2021 down to 32,500 in the spring, that's still a sizeable number of people not included in the labor force. This could include parents in a bind until in-person school starts up this fall, the immunocompromised, among others. It also shifts the Beveridge Curve a little further to the left than it would otherwise be.
There's a lot of pent-up demand to get out, and a lot of pent up savings and/or federal stimulus that went to households throughout 2020 and in spring 2021. More demand for goods, services, and travel means employers need to hire more, pushing up job openings.
Nationally, we know that the quits rate has recently been at the highest point we've ever seen. If someone quits their job, it creates a job opening to replace them.
Retirements are likely on the upswing again. As with a quit, when someone retires, it creates a replacement opening...and also means one less person in the labor force looking for work.
Are employers also doing some "preemptive posting?" If you already know it's going to be hard to hire in the coming months, do you get those upcoming job openings out there now to try to build a candidate pool?
What about enhanced unemployment benefits? We know that in winter 2021, on average, regular unemployment benefits were full wage replacement (about 103%) relative to the earnings of what those receiving benefits were earning at their pre-pandemic jobs. From January to June, the number of Oregonians receiving any kind of ongoing unemployment benefits fell by 30%. The resumption of job search registration and upcoming re-implementation of active work search requirements in July should diminish any remaining labor force disincentives related to benefits.
The Beveridge Curve shows a current labor market dynamic in Oregon that continues to be incredibly competitive for hiring. Employers have already added 57,800 jobs in the first half of this year. Leading up to the pandemic, it took Oregon 22 months to add about that many jobs. Rapid hiring and barriers holding some out of the labor force are contributing to ongoing labor shortages.
More information about Oregon's job vacancy survey is available at https://www.qualityinfo.org/pubs. Questions about Oregon's Beveridge Curve can be sent to Gail.K.Krumenauer@oregon.gov.
Oregon businesses reported 97,800 vacancies in spring 2021. Total job openings increased 77% from the winter and 130% from spring 2020. This is the highest number of job vacancies seen in Oregon since the beginning of this survey in 2013. The previous high was 66,600 vacancies in summer 2017. The record high level of job vacancies is not unique to Oregon right now. The number of private-sector job openings in the U.S. totaled 8,995,000 in April 2021, beating the previous high seen in October 2018 (7,055,000) significantly.
Most openings in the spring were for full-time, permanent positions. Health care and social assistance topped the industry list in spring, with 22,200 vacancies. This has been the sector with the most vacancies 20 of the past 22 quarters. The leisure and hospitality industry had 19,900 vacancies, with 55% full-time positions and 7% requiring education beyond high school.
Hiring demand was widespread throughout industries and occupations. Four industries experienced record high vacancies: health care and social assistance, leisure and hospitality, retail trade (10,500 vacancies), and other services (7,000 vacancies). A majority of employers in every industry reported their vacancies as difficult to fill. Overall, 71% of vacancies were considered difficult to fill, another record high for this series.
Employers reported vacancies in more than 240 different occupations. The occupations with the most vacancies in spring 2021 were: retail salespersons (5,500 vacancies), maids and housekeeping cleaners (4,800 vacancies), personal care aides (3,700 vacancies), and waiters and waitresses (3,300 vacancies).
The average starting wage reported in spring was $18.44, a 3% inflation-adjusted increase from spring 2020. Total vacancies were up 130% from the level last spring at the height of pandemic restrictions. The number of vacancies offering a starting wage below $15 per hour increased the slowest, at 64%. The number of vacancies offering between $15 and $25 per hour more than doubled (+187%), as did vacancies paying above $25 per hour (+174%).
Oregon's unemployment rate continued its gradual improvement in 2021, dropping to 5.6% in June. This reflects more Oregonians getting back on the job. Nonfarm payrolls added 7,500 jobs in June.
Oregon has regained 64% of the jobs lost in spring 2020, compared with 70% for the U.S. While that still leaves quite a gap to return to pre-pandemic employment levels, the pace of hiring has been relatively fast in 2021. Oregon added 57,800 jobs in the first half of the year. Leading up to the pandemic, it took 22 months for Oregon to add about that many jobs.
In June, private health care and social assistance added the most jobs (+2,400). Other services -- which includes barber shops, hair salons, repair services, and others -- added 1,700 jobs over the month. Leisure and hospitality resumed hiring, adding 1,000 jobs.
While most sectors still have fewer jobs than before the pandemic, two private industries have more jobs now than they did in February 2020. Transportation, warehousing, and utilities is 4,400 jobs (or 6%) above its pre-pandemic employment level. Professional and technical services employs 3,100 (or 3%) more than before the pandemic recession.
In Oregon, nonfarm payroll employment grew by 6,900 in May, following monthly gains averaging 11,400 in the
prior four months. Monthly gains in May were largest in private education (+3,400 jobs); professional and
business services (+2,900); construction (+900); and financial activities (+900). Only one major industry shed
more than 500 jobs in May: transportation, warehousing, and utilities (-800 jobs).
In May, Oregon’s nonfarm payroll employment totaled 1,864,000, a drop of 109,000 jobs, or 5.5% from the prerecession peak in February 2020. Oregon’s employment dropped to a low of 1,687,500 by April 2020. Since then,
Oregon has recovered 176,500 jobs, or 62% of the jobs lost between February and April 2020.
Leisure and hospitality accounts for the bulk of Oregon’s jobs not recovered since early 2020. It employed
169,600 in May, and added only 1,600 jobs in the most recent two months. The industry is still 46,700 jobs below
its peak month of February 2020, so it accounts for 43% of overall nonfarm payroll jobs lost since Oregon’s prerecession peak. The restaurants, bars, and hotels that make up accommodation and food services have shown
flat hiring trends over the most recent three months; the employment level in this component industry has been
close to 150,000 in March, April, and May.
Hiring in Oregon slowed significantly in April. Total nonfarm payrolls added 2,200 jobs, following a revised gain of 19,600 in March. Oregon's unemployment rate was unchanged at 6.0%.
Job growth also slowed nationwide in April, and the U.S. unemployment rate was 6.1%. Oregon has regained 59% of the jobs lost in spring 2020, compared with 63% for the U.S.
April job gains in Oregon were largest in government, which added 2,300 jobs as many K-12 schools moved from fully remote to partially in-person instruction. Leisure and hospitality added 2,000 jobs over the month. Monthly declines were largest in manufacturing, which dropped by 900 jobs.
Although Oregon's unemployment rate hit a stand-still in April, underlying labor force dynamics continued to shift. April marked the first month since the pandemic recession started that those experiencing permanent job losses were the largest group of laid off Oregonians. At the height of the pandemic shutdowns a year ago, nine out of 10 layoffs were temporary.
We've been hearing more in recent days about employers' challenges finding workers. Over the past week, we've teamed up with the Office of Economic Analysis to publish a summary of reasons Oregon's labor market is tighter than you might think.
The pandemic recession -- just like all economic downturns -- is unique. During this recovery labor demand remains strong. At the same time, several simultaneous factors are constraining the supply of labor for those job openings. They include:
1. Concentrated Nature of the Shock Last spring, many businesses with similar labor pools shut down overnight. The economy experienced record-setting job losses and the unemployment rate increased nearly 10 percentage points in April 2020 alone. Those who remain unemployed are also largely on temporary layoff. In the previous recessions, the job losses were largely permanent, and the economic nadir did not occur until more than two years into each cycle, so businesses hiring during the recession and recovery had excess labor supply for a while. During this recovery the jobless numbers have dropped much faster.
Oregon’s unemployment rate matched the nation’s at 6.0% in March, below the average of 6.8% over the past two decades. Currently, hiring employers are facing a typical or slightly lower-than-typical available labor pool for their job openings. The available labor force is not evenly distributed either. While all sectors lost jobs in the initial COVID downturn, some have bounced back rapidly or hit new employment highs (such as transportation, warehousing and utilities, and professional and technical services). Depending upon the types of jobs employers are hiring for, there may be no excess labor.
2. Pandemic Concerns The unemployment rate doesn’t include would-be workers who are out of the labor force, meaning they neither have a job, nor are they looking for one. Supplemental information from households in the Current Population Survey shows an estimated 45,000 people in Oregon said they were prevented from looking for work due to COVID-related reasons during the first quarter of 2021. While vaccinations have accelerated, only about half the adult population has received at least one vaccine dose for COVID-19 as of mid-April. COVID case counts are also rising in many areas of Oregon again this spring.
3. Lack of In-Person Schooling Heading into the pandemic, one out of every six Oregonians in the labor force had kids, worked in an occupation that cannot be done remotely, and also did not have another non-working adult present in the household, according to research from the Office of Economic Analysis. As of mid-April, three-fourths of Oregon’s K-12 schools have students learning remotely from home either part- or full-time, according to Oregon Department of Education records.
Even with the anticipated return of full-time, in-person learning for the 2021-2022 school year, child care slots, which were already too scarce in most areas of the state prior to the pandemic, and summer programs will likely continue operating with reduced capacity for some time. These constraints limit workforce options for some parents of younger children.
4. Federal Aid and Unemployment Benefits Total personal
income in Oregon today is about 15% higher than before the pandemic.
Strong federal fiscal policy response via recovery rebates alone added
$12 billion to personal income in Oregon. Although this has brightened
the overall economic outlook, a stronger safety net where incomes are
higher today than pre-COVID can temporarily reduce labor force
participation in the short term for some workers.
Federal
Pandemic Unemployment Compensation (FPUC) adds $300 onto weekly
unemployment insurance benefits through September 4, 2021. In the first
quarter of 2021, the weekly regular unemployment (UI) benefit has
averaged $370 per week. With the additional $300 FPUC payment, that adds
up to an average payment of $670 per week. That’s roughly the same as
earning $16.75 per hour for someone working full time. During the first
quarter of 2021, that has also represented full wage replacement
(between 100% and 104%) relative to regular UI claimants’ pre-pandemic
earnings on the job.
Some perspective here: earning $670 per week, working year round would total $34,800 in gross earnings for a worker. By comparison, the median earnings for full-time workers in Oregon in 2019 was $50,712. With “Now Hiring” signs in many business windows and stronger wage offerings as employers compete for available workers, it’s unlikely that this benefit, in itself, is keeping a vast number of workers on the sidelines.
Furthermore, unemployed workers cannot refuse job offers or a recall
to their previous job (if temporarily laid off) because of their
unemployment benefit amount. Refusing work solely due to weekly
unemployment benefit payments would be considered fraud. The Employment
Department provides ways to report job refusals.
Last but not least, Oregon has a long-running record of adding labor force through net in-migration of workers from
other states and areas. While Oregon continued to attract migrants in
2020, net migration fell to its lowest level since 2013 in Oregon, and
was 20% lower at 28,600 than in 2019.
More information on Oregon's current labor market dynamics can be found in the full article and OEA blog post, written by State Economist Josh Lehner and State Employment Economist Gail Krumenauer.
Nonfarm payroll employment rose 20,100 jobs in March, following a gain of 15,300, as revised, in
February. Two-thirds of all the jobs gained in March were in leisure and hospitality (+13,900 jobs).
Three other major industries each added more than 1,000 jobs: manufacturing (+2,000 jobs);
professional and business services (+1,300); and transportation, warehousing, and utilities
(+1,100). Construction and private educational services each added 700 jobs. All other major
industries performed close to their normal seasonal patterns.
The 20,100 total nonfarm jobs added in March was Oregon’s largest monthly gain since 38,300 jobs
were added in July. March’s gain was the third monthly increase, following a large drop in December
that was the result of temporary, heightened restrictions at the time.
In March, Oregon’s nonfarm payroll employment totaled 1,840,600, a drop of 132,400 jobs, or 6.7%
from the pre-recession peak in February 2020. Oregon’s employment dropped to a low of 1,687,500 by
April 2020. Since then, Oregon has recovered 153,100 jobs, or 54% of the jobs lost between February
and April 2020.
Oregon’s unemployment rate edged down to 6.0% in March, from 6.1% in February. For the past three months, Oregon’s unemployment rate has ticked down by a tenth of a point each month. During the past 11 months the pace of recovery in Oregon’s unemployment rate has mirrored the national experience. The U.S. unemployment rate dropped to 6.0% in March, from 6.2% in February.
Oregon’s longest post-WW II economic expansion came to a dramatic end in 2020. The cumulative devastation Oregonians faced in their lives and their livelihoods throughout 2020 translated to slow recovery from unparalleled job losses.
The pandemic recession had a faster onset with deeper impacts than even the Great Recession. The record-breaking layoffs that occurred in the spring of 2020 in response to the COVID-19 pandemic also occurred at breathtaking speed. Oregon lost 285,500 nonfarm payroll jobs from February to April, a decline of 14.5%. By comparison, at the steepest point of decline in the Great Recession, 27 months into the downturn, employment had dropped 8.5% from its peak.
One distinction of the pandemic recession was that overwhelmingly, those who became unemployed due to job loss were on temporary layoff. At peak unemployment in April 2020, those who lost jobs accounted for 84% of unemployed Oregonians. Among them, 86% were classified as on temporary layoff. That’s quite a reversal from the Great Recession; during its months of highest unemployment, nearly three-fourths (72%) of layoffs were due to permanent job losses.
In addition to those who lost jobs – temporarily or permanently – many more Oregonians found themselves working less than they would have liked in 2020. Oregon’s broadest (“U-6”) measure of labor underutilization hit a series high of 20.9% in April 2020. That means one out of five workers or would-be workers were either out of work, discouraged from looking due to lack of prospects, sought work in the past year but not the past four weeks, or were working fewer hours than they’d like to be scheduled.
Most of those in this expanded measure of labor underutilization were involuntary part-time workers. Between February and May 2020, the number of Oregonians working part-time for economic reasons doubled to 159,700.
Another distinction of the pandemic recession was that, through either
federal loans or altered business practices, many Oregon employers were
able to keep operating either with fewer workers, or with workers on
reduced schedules. Throughout 2020, the number of business
establishments overall grew each quarter. Even in leisure and
hospitality, the hardest-hit sector that lost half its jobs in spring
2020, the total number of payroll business units remained stable
throughout the year.
Phased re-opening began in Oregon in May,
and with it, record-breaking monthly job gains came. Oregon had its
largest-ever monthly employment gain in June 2020, adding 52,300 jobs.
That momentum was not sustained though; monthly job gains tapered over
the summer and into fall Oregon continued to register smaller monthly
gains heading into the fall.
As COVID-19 cases also began to rise
in the fall, Oregon instituted an initial “two week freeze” that
included additional health and safety measures. Subsequent limitations
on economic activity to prevent community spread of the disease by
county and COVID-19 risk category continued through the rest of 2020 and
into 2021.
In December 2020, Oregon lost 27,500 jobs over the
month. Absent the pandemic, that December loss would have represented
the biggest monthly job decline in Oregon since at least 1990.
In the wake of lower COVID-19 case counts and accelerated vaccine rollout, more areas of the state have moved out of extreme COVID risk categories, and job gains have
resumed. Total nonfarm payrolls in Oregon added a combined 20,900 jobs
in January and February 2021. The latest forecast
from the Office of Economic Analysis predicts stronger growth in 2021
and 2022 than Oregon has seen in decades, and a return to pre-pandemic
employment in early 2023.
Oregon lost 25,500 jobs in December, and the unemployment rate rose to 6.4%. Oregon closed out 2020 having added back 37% of the 285,000 jobs we lost in the spring. Job losses also occurred nationally (-140,000) in December, and the U.S. unemployment rate remained at 6.7%. The U.S. has regained 56% of jobs lost in the COVID-19 recession.
Three sectors in Oregon topped the list in terms of most jobs added in December, with a gain of 2,200 each:
Transportation, warehousing, and utilities growth reflected a surge in holiday hiring, and heightened pandemic demand, for package deliveries and the associated distribution system that gets them to your door.
Retail trade also saw a seasonal shopping bump.
Private health care and social assistance has generally been back on its long-run growth trend, although it remains 9,600 jobs below February 2020.
Sectors with the largest monthly declines in December:
Leisure and hospitality took the brunt of the losses. As of November, the sector had regained half (56,400) the 110,500 jobs lost in the spring. Roughly half of those recovered jobs were lost in December (-28,600). Leisure and hospitality consists of two parts:
Accommodation and food services (restaurants and bars), which shed 24,800 jobs over the month.
Arts, entertainment, and recreation employers dropped 3,800 jobs over the month. This portion of leisure and hospitality is now at a lower employment level than it was in April, the point from which overall employment began to recover.
Private education services declined by 1,700 jobs in December, and is also below its April employment level. Local government employment (half of which is K-12 or higher education) also continued to decline in December, dropping by 1,100 jobs. Local government now has fewer jobs than it did in April, and is 27,500 jobs below its December 2019 level.
One bright spot in a dismal jobs year:
Transportation, warehousing, and utilities was the only broad sector of the economy that added jobs between December 2019 and December 2020. Its impressive 8.1% rate of growth (+6,000 jobs) would be extraordinary even during an economic expansion, and remains a sharp contrast to the rest of Oregon’s labor market in 2020.
Oregon’s unemployment rate dropped to 6.0% in November from 6.8%, as revised, in October. This put Oregon’s rate below the U.S. unemployment rate which dropped to 6.7% in November from 6.9% in October.
“On Nov. 18th, Oregon implemented a ‘freeze’ to combat the rise of COVID-19 in the state. This employment press release covers Oregon’s employment situation just prior to the ongoing freeze, which has affected employers and tens of thousands of workers in recent weeks,” said Gail Krumenauer, State Employment Economist with the Oregon Employment Department.
Oregon’s total nonfarm payroll employment rose by 4,200 jobs in November, following a revised gain of 9,800 jobs in October. Oregon employers added jobs in each of the past seven months, and the state has recovered 46% of the jobs cut in March and April. Over the past five months the rate of job growth slowed. Monthly growth averaged 9,600 jobs in September and October, while more rapid gains averaging 17,000 per month occurred in July and August.
Over-the-month job gains in November were largest in transportation, warehousing, and utilities (+3,100 jobs); professional and business services (+2,600); manufacturing (+1,700); and health care and social assistance (+1,500). Monthly losses were concentrated in construction (-2,300 jobs); government (-1,800); and retail trade (-1,100).
Transportation, warehousing, and utilities added the most jobs in November and was the only major industry to add jobs since November 2019. Online shopping is booming and the industry has hired thousands of workers to keep up with demand in warehouses and for delivery drivers. The industry is up 7,500 jobs, or 10.3%, since November 2019.
Leisure and hospitality added 300 jobs in November, following a revised gain of 3,300 in October. However, these gains recovered only a fraction of the 110,500 jobs cut in March and April. The industry—which is includes restaurants, bars, motels, and arts, entertainment, and recreation employers—has been the hardest hit industry due to the pandemic. In November, it employed 161,300 in Oregon, nearly 25% fewer than in November 2019 when it employed 214,900.
Next Press Releases The Oregon Employment Department plans to release the November county and metropolitan area unemployment rates on Tuesday, Dec. 22nd, and the next statewide unemployment rate and employment survey data for December on Wednesday, Jan. 20th.
In September 2020, 31 of Oregon’s 36 counties experienced over-the-month decreases in their unemployment rates. In 19 counties, unemployment rates dropped by half a percentage point or more. Multnomah and Jefferson counties experienced the largest over-the-month decreases at 1.1 percentage point each. Over-the-month unemployment rates remained unchanged in four counties: Jackson, Linn, Lake, and Wheeler. Douglas County saw a slight increase in its unemployment rate over the month (+0.2pp).
Lincoln County had Oregon’s highest seasonally adjusted unemployment rate in September at 10.6 percent. Other counties with some of the highest unemployment rates include Multnomah (9.5%), and Crook (9.1%).
Wheeler County registered the lowest unemployment rate for the month at 4.4 percent. Other counties with some of the lowest unemployment rates in September were Morrow (5.3%) and Benton (5.6%). Twenty-two counties had unemployment rates at or below the statewide rate of 8.0 percent. Twenty-one counties also had unemployment rates at or below the nationwide rate of 7.9 percent. Total nonfarm payroll employment declined sharply in all six of Oregon’s broad regions between September 2019 and September 2020. The largest job losses occurred in the Coast region (-9.6%). Portland-5 (-8.2%), Central Oregon (-7.3%), and the Willamette Valley (-6.9%) also experienced large over-the-year employment losses. Read the original press release here.
Oregon’s unemployment rate dropped to 8.0 percent in September from 8.5 percent, as revised, in August. For the past few months, Oregon’s unemployment rate has closely tracked the national unemployment rate which fell to 7.9 percent in September from 8.4 percent in August.
Oregon’s total nonfarm payroll employment rose by 5,100 jobs in September, following a revised gain of 16,200 jobs in August. Over the past three months the rate of job growth slowed, with 39,000 jobs added in that time, following more rapid growth in May and June, when 83,100 jobs were added. Despite the recent slowdown, Oregon employers added jobs in each of the past five months, and the state has recovered 45 percent of the jobs cut in March and April.
Over-the-month job gains in September were largest in leisure and hospitality (+2,600 jobs); financial activities (+1,600); health care and social assistance (+1,600); retail trade (+1,500); and information (+1,200). Two industries cut a substantial number of jobs in September: construction (-2,600 jobs) and private educational services (-1,400).
Leisure and hospitality continues to be the industry most impacted by the economic effects of the COVID-19 pandemic. Its employment bounced back substantially in May and June, but job gains have slowed over the past three months. Employment totaled 163,200 in September, which was down 53,400 jobs, or 24.7%, since its peak month of February.
Manufacturing lost a substantial number of jobs this spring and hasn’t rebounded. Employment stood at 180,000 jobs in September, which was close to its level of the past five months. Since September 2019, manufacturing cut 18,100 jobs with losses widespread throughout most component industries. During that time, primary metals manufacturing dropped the most in percentage terms, shedding 2,600 jobs, or 28 percent. Next in line was transportation equipment manufacturing which cut 19 percent. Two other manufacturing industries dropped at least 10 percent: food manufacturing (-4,200 jobs, or -14%) and electronic instrument manufacturing (-600 jobs, or -11%). None of the published manufacturing industries added a substantial number of jobs over the past 12 months.
In contrast, two major industries rose closer to pre-pandemic employment levels. Retail trade rebounded rapidly, adding 4,700 jobs over the past two months. This left the industry down only 4,800 jobs, or 2.3 percent, since February. Certain retailers responded to strong demand lately, with food and beverage stores up 900 jobs, or 2.1 percent, since last September. Similarly, building material and garden supply stores added 900 jobs, or 5.4 percent in that time, while general merchandise stores added 1,100 jobs or 2.7 percent. Clearly consumer preferences and demands have shifted substantially, as reflected by job losses in several categories including clothing stores, which cut 8,100 jobs, or 51.6 percent, over the year, and miscellaneous store retailers, which shed 2,800 jobs, or 16.5 percent.
Health care and social assistance added 2,300 jobs over the past two months and was only 8,200 jobs, or 3.1 percent, below its recent high in February. Over the past 12 months, social assistance cut 4,900 jobs, or 8.4 percent. However, health care declined only 800 jobs in that time.
Oregon’s total employment will grow by 181,800 jobs between 2019 and 2029, according to new projections from the Oregon Employment Department. The projections point to modest job growth between 2019 and 2029, although many job openings are expected due to the need to replace workers who leave their occupations.
In 2019, there were 2,120,000 jobs in Oregon. The 9 percent increase in employment between 2019 and 2029 includes private-sector gains of 156,400 jobs, growth of 16,500 jobs in government, and an additional 8,900 self-employed Oregonians.
Beyond gains from economic growth, another 255,300 job openings will be created on average each year through 2029 to replace workers who retire, leave the labor force for other reasons, or make a major occupational change. Together, the number of job openings due to economic growth and replacements will total an annual average of 273,500.
All private sectors in Oregon are expected to add jobs by 2029. Private health care and social assistance will lead all industries in new job growth. The gain of 46,300 new jobs (15% growth) in health care can be attributed to continued growth and aging of the state’s population. Healthcare will account for one out of every five new jobs created in Oregon by 2029.
Health care also tops the list of Oregon’s fastest-growing occupations over the 10-year period. Healthcare occupations and those associated with healthcare, including mental health, account for 13 of the 20 fastest-growing occupations from 2019 to 2029 among occupations with at least 1,000 jobs in Oregon. Oregon’s second fastest-growing industry will be professional and business services (13% growth).
A broad variety of career opportunities will be available across all sectors as well as all job types. One-third of all job openings will require education or training beyond high school at the typical entry-level education. To meet more competitive education requirements, nearly half of all job openings require at least some training beyond high school.
All areas of Oregon expect to see job opportunities due to both economic growth and to replace workers leaving the labor force in the coming years. The two regions projected to grow at the fastest rates are Central Oregon (12%) and the Portland area (11%).
Additional Information The Oregon Employment Department’s 2019-2029 employment projections are long-term projections intended to capture structural change in the economy, not cyclical fluctuations. As such, they are not intended to project the full impacts of the COVID-19 recession and its recovery.
Devastating wildfires have ravaged workplaces, homes, communities, and more than 1 million acres of land across Oregon over the past several days. This release covers the Oregon employment situation in August. It does not capture the personal and economic disruption caused by these disasters.
Oregon’s unemployment rate dropped to 7.7 percent in August from 10.4 percent in July. The unemployment rate was more than double last year’s rate of 3.6 percent in August 2019. Meanwhile, the U.S. unemployment rate dropped to 8.4 percent in August from 10.2 percent in July.
Oregon’s total nonfarm payroll employment rose by 11,300 jobs in August, following a revised gain of 17,700 jobs in July. Over the past four months, employers added back 41 percent of the jobs that were cut in March and April.
Over-the-month job gains in August were largest in leisure and hospitality (+4,200 jobs); retail trade (+3,300); construction (+3,200); and government (+3,000). Two industries cut a substantial number of jobs in August: wholesale trade (-1,400 jobs) and health care and social assistance (-1,400).
Leisure and hospitality—which includes restaurants, drinking establishments, hotels, and recreational industries—has added back the most jobs of any of the major industries over the past four months. Despite adding 63,200 jobs during the past four months, leisure and hospitality is only a little over halfway back to its February 2020 peak employment level, prior to the economic effects of the COVID-19 pandemic. Retail trade has bounced back closer to its recent peak employment level. It added 16,100 jobs over the past four months, which was nearly three-quarters of the jobs lost earlier in the year. The third industry to add back more than half of its jobs lost, while also rebounding by more than 10,000 jobs, was health care and social assistance. This industry, despite a 1,400-job loss in August, added 18,000 jobs over the past four months, regaining nearly two-thirds of its March and April job losses.
Not all industries have rebounded with substantial job growth over the past four months. In August, the following industries remained near their low point for the year: manufacturing; government; information; and professional and business services.
Oregon’s total nonfarm payroll employment rose by 20,500 jobs in July, following a gain of 57,000 jobs in June. Over the past three months, employers added back 38 percent of the jobs that were cut in March and April.
Over-the-month job gains in July were largest in leisure and hospitality (+7,300 jobs); government (+5,700); retail trade (+3,600); health care and social assistance (+3,100); and professional and business services (+1,900). Meanwhile, three of the major industries cut a substantial number of jobs in July: construction (-1,900 jobs); manufacturing (-1,500); and information (-1,200).
Over the past five months the major industries were impacted differently by the pandemic. Leisure and hospitality suffered by far the largest job loss during March and April, shedding 118,700 jobs during the outset of the pandemic-induced drop in business. Then, between April and July, the industry regained half of the loss, as it rebounded by 58,900 jobs over the past three months. Three industries regained more than half of their lost jobs. Health care and social assistance regained two-thirds of its lost jobs, with a rebound of 18,700 jobs over the past three months. During that time, two industries regained nearly two-thirds of their lost jobs: other services (+9,300 jobs, or a 63% rebound) and retail trade (+13,900 jobs, or 62%).
However, several key industries experienced substantial job losses in March and April but have not rebounded substantially or have even declined further over the past three months. The following industries shed jobs between April and July: government (-5,200 jobs); manufacturing (-3,100); and information (-1,900). Most of the other major industries have regained fewer than 5,000 jobs each over the past three months while regaining less than a third of jobs lost during March and April. These industries include construction; financial activities; private education; professional and business services; and transportation, warehousing, and utilities.
Oregon’s unemployment rate dropped to 10.4 percent in July from 11.6 percent, as revised, in June. In July, Oregon’s unemployment rate was very close to the U.S. unemployment rate; the U.S. rate dropped to 10.2 percent in July from 11.1 percent in June.
In June 2020, all 36 of Oregon’s counties experienced over-the-month decreases in their unemployment rates. In 16 of Oregon’s 36 counties, unemployment rates dropped by 3 percentage points or more. Clatsop County experienced the largest over-the-month decrease at 8.1 percentage points. Counties with the smallest percentage point changes in their unemployment rates since May 2020 include Wheeler (-0.3pp), Gilliam (-0.6pp), and Lake and Morrow (-0.4pp).
Lincoln County had Oregon’s highest seasonally adjusted unemployment rate at 17.0 percent. Other counties with some of the highest unemployment rates in June include Clatsop (15.2%), Crook (13.5%), and Curry (13.4%).
Wheeler County registered the lowest unemployment rate for the month at 5.7 percent. Other counties with some of the lowest unemployment rates in June were Morrow (7.0%) and Malheur (7.4%). Twenty-two counties had unemployment rates below the national rate of 11.1 percent. Twenty-three counties also had unemployment rates at or below the statewide rate of 11.2 percent.
Total nonfarm payroll employment declined sharply in all six of Oregon’s broad regions between June 2019 and June 2020. The largest job losses occurred in the Coast region (-14.8%) and Central Oregon (- 11.6%). Eastern Oregon (-10.4%), the Willamette Valley (-8.5%), and Southern Oregon (-8.0%) also experienced large over-the-year employment losses. Read the original press release here.
Oregon’s total nonfarm payroll employment rose by 56,600 jobs in June, following a gain of 26,100 jobs in May. Over the past two months, employers added back nearly one-third of the jobs that were cut in March and April.
Over-the-month job gains in June were largest in leisure and hospitality (+31,400 jobs); retail trade (+6,800); health care and social assistance (+6,200); and other services (+5,700). None of the major industries cut a substantial number of jobs in June.
Several major industries have regained around half the jobs they lost in March and April. Leisure and hospitality added a total of 47,600 jobs in May and June, which was 39 percent of the 121,500 jobs the industry cut during March and April. Health care and social assistance added 15,700 jobs in May and June, recovering 59 percent of the 26,800 jobs it lost the prior two months. Similarly, retail trade bounced back by 11,500 jobs, or 49 percent, in the past two months, from the 23,300 jobs it shed in March and April.
However, many of the larger industries haven’t seen a substantial rebound in the past two months, including professional and business services, which cut 20,200 jobs in March and April, but has only regained 1,900 jobs during May and June. Fairing even worse were the several industries that have shown no net jobs recovery over the past two months. Manufacturing employed 181,000 in June, which was 2,400 jobs below its April total. Also in the past two months, government cut 9,100 jobs between April and June, during which time management of companies and enterprises cut 1,000 jobs and information cut 600 jobs.
Oregon’s unemployment rate dropped to 11.2 percent in June from 14.3 percent, as revised, in May. In June, Oregon’s unemployment rate was very close to the U.S. unemployment rate; the U.S. rate dropped to 11.1 percent in June from 13.3 percent in May.
“Although Oregon experienced job gains due to the limited resumption of economic activity in May, over the past three months of the COVID-19 pandemic job losses have totaled 243,500. Historically, this loss is unprecedented and currently thousands of Oregonians are still suffering the economic realities of being unemployed,” said Anna Johnson, Senior Economic Analyst with the Oregon Employment Department.
Oregon’s unemployment rate declined to 14.2 percent in May from 14.9 percent, as revised, in April. Meanwhile, the U.S. unemployment rate dropped to 13.3 percent in May from 14.7 percent in April. Oregon’s April unemployment rate was the state’s highest since comparable records began in 1976.
Oregon total nonfarm payroll employment rose by 22,500 jobs in May, following a loss of 252,800 jobs in April. Thus, in May, employers added back nearly one in 10 jobs that were cut in April. Over-the-month job gains in May were largest in leisure and hospitality (+15,900 jobs); health care and social assistance (+8,400); construction (+5,600); and retail trade (+3,200). These gains were countered by substantial monthly losses in manufacturing (-4,900 jobs) and government (-9,900).
During May, statewide and county-specific guidelines for reopening businesses fostered increases in customer demand within leisure and hospitality. Full-service restaurants added back 8,500 jobs in May following steep job cuts in the prior two months. This industry employed 29,900 in May, which was still down more than half from its year-ago total of 72,700 jobs. Limited-service eating places, which includes fast-food establishments, saw its employment rebound by 5,400 in May to reach a total of 49,600. That was still nearly a third below its year-ago headcount of 71,700. Accommodation, which includes hotels and motels, added 1,600 jobs in May, but is still below half of its employment level of 26,500 reached in May 2019.
Additionally, some restrictions were lifted on elective and routine medical procedures. Ambulatory health care services responded with a gain of 8,300 jobs. Totaling 86,900 jobs in May, the industry was still 7,300 jobs below its May 2019 total.
On the down side, durable goods manufacturing cut 6,300 jobs in May. Much of these cuts were concentrated in primary metal manufacturing (-1,300 jobs) and in computer and electronic product manufacturing (-2,500 jobs). The portion of government with a big job change in May was local government education, which dealt with pandemic-induced school closures from kindergarten through universities, resulting in job cuts totaling 8,300.
COVID-19 Impact
April seasonally adjusted unemployment rates are not available for Oregon counties due to processing delays caused by large increases in unemployment. Not seasonally adjusted unemployment rates are being used for this news release. They reflect April’s increase in unemployment related to the COVID-19 pandemic. Seasonally adjusted unemployment rates for April will be available on Qualityinfo.org or by request at a later date. We apologize for any inconvenience this causes.
April Employment and Unemployment
In April 2020, all of Oregon’s 36 counties experienced over-the-month increases in their unemployment rates. Eighteen of Oregon’s 36 counties experienced over-the-month unemployment rate increases of 10 percentage points or more. Lincoln County experienced the largest over-the-month increase at 21.5 percentage points. Counties with the smallest percentage point changes in their unemployment rates since March 2020 include Wheeler (+2.5%), Morrow (+3.7%), and Harney (+4.3%).
In April 2020, Lincoln County registered the highest unemployment rate for the month at 26.2 percent. Other counties with some of the highest unemployment rates in April were Clatsop (24.4%), Union (19.3%), and Coos (18.8%).
Wheeler County had Oregon’s lowest not seasonally adjusted unemployment rate at 5.8 percent. Other counties with some of the lowest unemployment rates in April include Morrow County (8.1%), Malheur (8.3%), and Lake (9.7%). Eighteen counties had unemployment rates below the national unadjusted rate of 14.4 percent. Nineteen counties also had unemployment rates at or below the statewide unadjusted rate of 14.8 percent.
Total nonfarm payroll employment declined sharply in all six of Oregon’s broad regions between April 2019 and April 2020. The largest job losses occurred in the Coast region (-19.7%) and Central Oregon (-14.7%). The Willamette Valley region (-12.9%), Southern Oregon (-12.3%), Eastern Oregon (-10.3%), and the Portland area (-9.7%) also experienced large over-the-year employment losses.
Next News Releases
The Oregon Employment Department will release statewide unemployment rate and industry employment data for May 2020 on Tuesday, June 16, 2020. The May 2020 county and metropolitan area unemployment rates will be released on Tuesday, June 23, 2020.