In June, unemployment rates declined in 18 of Oregon’s 36 counties. Unemployment rates in 17 counties did not decline, but held steady over the month. The unemployment rate increased in Umatilla County. Fourteen counties had unemployment rates at or below the statewide and nationwide rate of 3.6% in June.
Klamath and Grant counties had Oregon’s highest seasonally adjusted unemployment rate (5.2%) in June. Other counties with relatively high unemployment rates were Curry (4.8%), Crook (4.7%), Josephine (4.7%), and Lincoln (4.7%). Wheeler County registered the lowest unemployment rate (2.8%) in June. Other counties with some of the lowest unemployment rates in June included Benton, Hood River, Sherman, and Washington, at 2.9% each.
Between June 2021 and June 2022, total nonfarm employment rose in each of the six broad regions across Oregon. The Willamette Valley region experienced the fastest job growth over the year at 3.8%. Employment also grew at a relatively fast pace in the five Portland-metro counties (3.4%) and Central Oregon region (3.3%). Growth occurred at a slower pace along the Coast (1.6%), in Southern Oregon (0.7%), and in Eastern Oregon (0.5%).
Next News Releases
The Oregon Employment Department will release statewide unemployment rate and industry employment data for July 2022 on Wednesday, Aug. 17, 2022. The July 2022 county and metropolitan area unemployment rates will be released on Tuesday, Aug. 23, 2022.
In February 2022, 35 of Oregon’s 36 counties experienced over-the-month decreases in their unemployment rates. Wheeler County experienced no over-the-month change in its unemployment rate. Five counties experienced a 0.3 percentage point decrease or more over the month including Gilliam, Grant, Hood River, Jefferson, and Union counties.
Klamath County had Oregon’s highest seasonally adjusted unemployment rate in February at 5.5%. Other counties with some of the highest unemployment rates included Grant (5.4%), Curry (5.3%), Crook (5.2%), and Lincoln (5.2%).
Benton and Wheeler counties registered the lowest unemployment rate for the month at 3.0% each. Other counties with some of the lowest unemployment rates in February were Hood River (3.2%), Washington (3.3%), and Sherman (3.4%). Sixteen counties had unemployment rates at or below the statewide rate of 4.0%. Twelve counties also had unemployment rates at or below the nationwide rate of 3.8%.
Total nonfarm payroll employment increased in all six of Oregon’s broad regions between February 2021 and February 2022. Central Oregon has recovered from pandemic job losses. All other areas still have room to recover. The largest job increases since February 2021 occurred in the Central Oregon (5.5%) region. The Portland 5 (5.3%) and Willamette Valley (4.1%) regions also experienced large over-the-year employment increases. Growth occurred at a slower pace in other regions: Eastern Oregon (3.1%), Southern Oregon (1.8%), and the Coast (1.6%).
Next News Releases The Oregon Employment Department will release statewide unemployment rate and industry employment data for March 2022 on Wednesday, April 13, 2022. The March 2022 county and metropolitan area unemployment rates will be released on Tuesday, April 19, 2022.
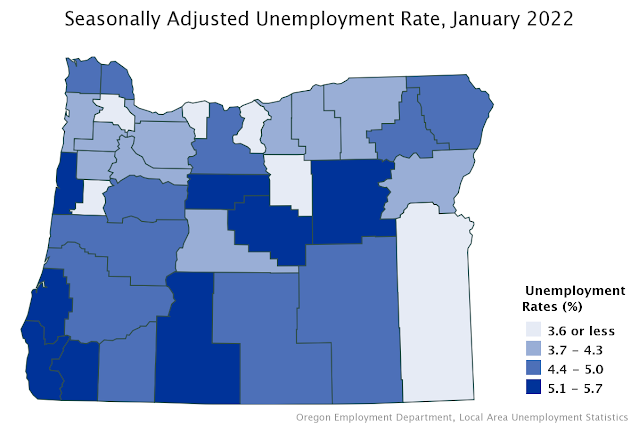
In January 2022, 25 of Oregon’s 36 counties experienced over-the-month decreases in their unemployment rates. Five counties experienced a 0.2 percentage point decrease or more over the month including Clatsop, Deschutes, Grant, Harney, and Jefferson counties.
Grant County had Oregon’s highest seasonally adjusted unemployment rate in January at 5.7%. Other counties with some of the highest unemployment rates included Klamath (5.6%), Crook (5.5%), Curry (5.5%), and Lincoln (5.4%).
Wheeler County registered the lowest unemployment rate for the month at 3.0%. Other counties with some of the lowest unemployment rates in January were Benton (3.1%), Washington (3.4%), and Hood River (3.5%). Seventeen counties had unemployment rates at or below the statewide rate of 4.3%. Twelve counties also had unemployment rates at or below the nationwide rate of 4.0%.
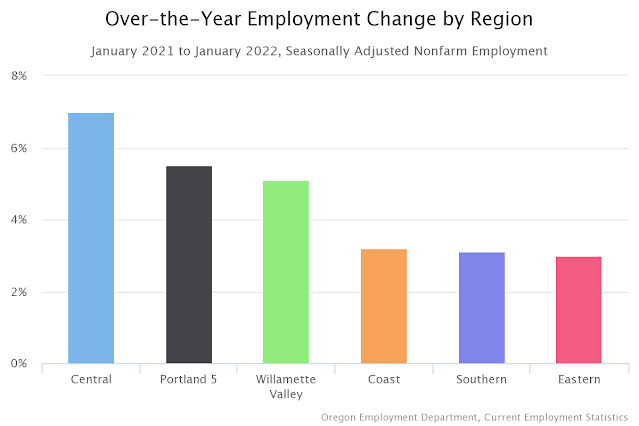
Total nonfarm payroll employment increased in all six of Oregon’s broad regions between January 2021 and January 2022. Most areas still have room to recover from pandemic job losses. The largest job increases since January 2021 occurred in the Central Oregon (7.0%) region. The Portland 5 (5.5%) and Willamette Valley (5.1%) regions also experienced large over-the-year employment increases. Growth occurred at a slower pace in other regions: the Coast (3.2%), Southern Oregon (3.1%), and Eastern Oregon (3.0%).
Next News Releases
The Oregon Employment Department will release statewide unemployment rate and industry employment data for February 2022 on Tuesday, March 22, 2022. The February 2022 county and metropolitan area unemployment rates will be released on Tuesday, March 29, 2022. Read the original press release here.
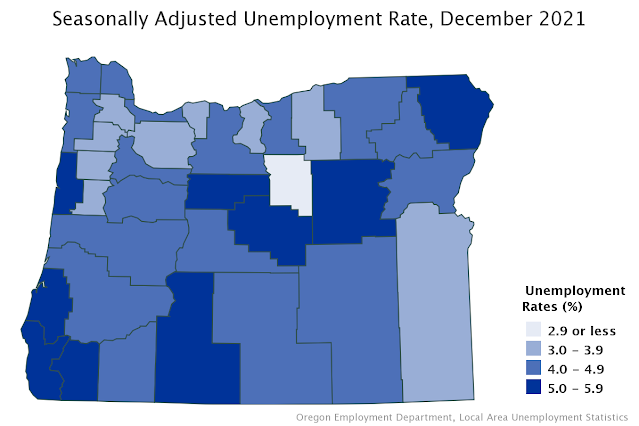
In December 2021, all of Oregon’s 36 counties experienced over-the-month decreases in their unemployment rates. Eight counties experienced a 0.3 percentage point decrease or more over the month including Clatsop, Crook, Deschutes, Grant, Hood River, Jefferson, Klamath, and Wasco counties.
Grant County had Oregon’s highest seasonally adjusted unemployment rate in December at 5.9%. Other counties with some of the highest unemployment rates included Klamath (5.7%), Crook (5.6%), Curry (5.6%), and Lincoln (5.5%).
Wheeler County registered the lowest unemployment rate for the month at 2.8%. Other counties with some of the lowest unemployment rates in December were Benton (3.1%), Washington (3.4%), and Hood River (3.6%). Twelve counties had unemployment rates at or below the statewide rate of 4.1%. Ten counties also had unemployment rates at or below the nationwide rate of 3.9%.
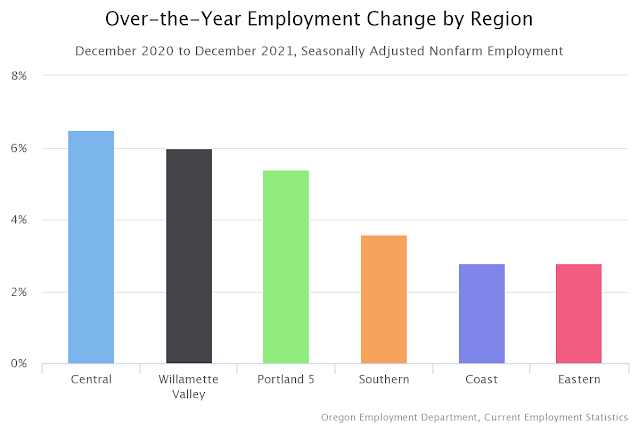
Total nonfarm payroll employment increased in all six of Oregon’s broad regions between December 2020 and December 2021. Most areas still have room to recover from pandemic job losses. The largest job increases since December 2020 occurred in the Central Oregon (6.5%) region. The Willamette Valley (6.0%) and Portland 5 area (5.4%) also experienced large over-the-year employment increases. Southern Oregon, the Coast, and Eastern Oregon regions added 2.6%, 2.8%, and 2.8%, respectively.
Next News Releases The Oregon Employment Department will release statewide unemployment rate and industry employment data for January 2022 on Tuesday, March 8, 2022. The January 2022 county and metropolitan area unemployment rates will be released on Tuesday, March 8, 2022.
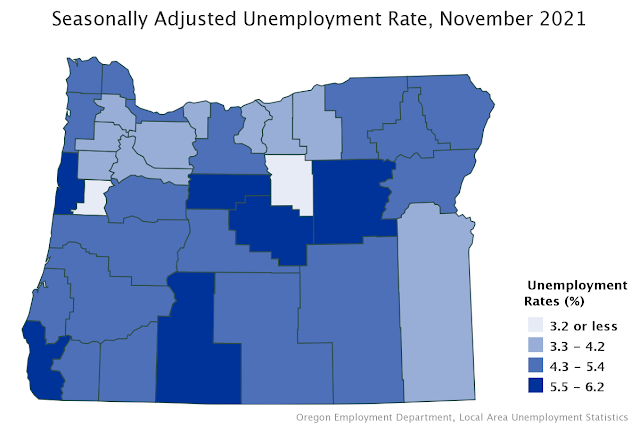
In November 2021, 35 of Oregon’s 36 counties experienced over-the-month decreases in their unemployment rates. Seventeen counties experienced a 0.3 percentage point decrease or more over the month including Baker, Clackamas, Clatsop, Coos, Crook, Curry, Gilliam, Klamath, Multnomah, Tillamook, Union, Wasco, Yamhill, Hood River, Deschutes, Lane, and Lincoln counties.
Grant County had Oregon’s highest seasonally adjusted unemployment rate in November at 6.2%. Other counties with some of the highest unemployment rates included Klamath (6.0%), Crook (5.9%), Curry (5.8%), and Lincoln (5.7%).
Wheeler County registered the lowest unemployment rate for the month at 2.8%. Other counties with some of the lowest unemployment rates in November were Benton (3.2%); Washington (3.5%); and Clackamas, Malheur, Sherman, and Yamhill (3.8% each). Twelve counties had unemployment rates at or below the nationwide and statewide rate of 4.2%.
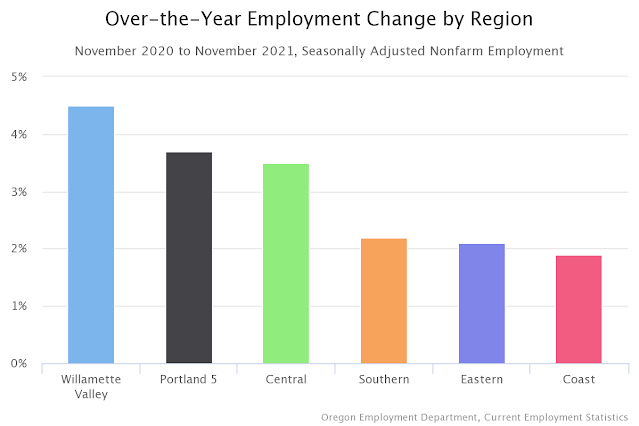
Total nonfarm payroll employment increased in all six of Oregon’s broad regions between November 2020 and November 2021. Most areas still have room to recover from pandemic job losses; the state has now recovered roughly three-quarters of jobs lost in March and April 2020. The largest job increases since November 2020 occurred in the Willamette Valley (4.5%). The Portland 5 area (3.7%) and Central Oregon (3.5%) also experienced large over-the-year employment increases. Southern Oregon, Eastern Oregon, and the Coast regions added 2.2%, 2.1%, and 1.9%, respectively.
Next News Releases
The Oregon Employment Department will release statewide unemployment rate and industry employment data for December 2021 on Wednesday, Jan. 19, 2021. The December 2021 county and metropolitan area unemployment rates will be released on Tuesday, Jan. 25, 2021.
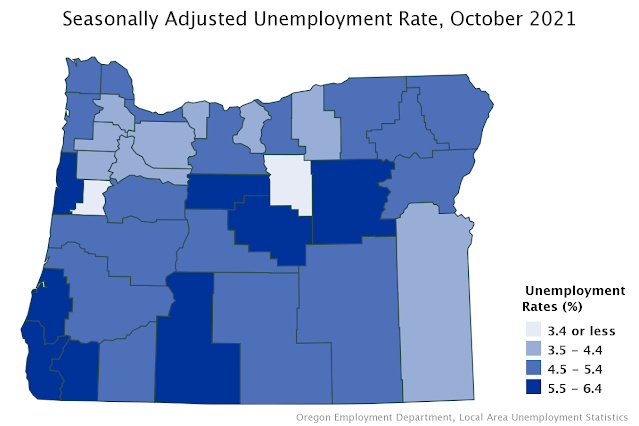
In October 2021, all of Oregon’s 36 counties experienced over-the-month decreases in their unemployment rates. Thirteen counties experienced a 0.4 percentage point decrease over the month including Clatsop, Columbia, Coos, Curry, Douglas, Gilliam, Jefferson, Josephine, Lincoln, Tillamook, Crook, Marion, and Multnomah counties.
Grant County had Oregon’s highest seasonally adjusted unemployment rate in October at 6.4%. Other counties with some of the highest unemployment rates included Klamath (6.3%), Crook (6.2%), Curry (6.1%), and Lincoln (6.1%).
Wheeler County registered the lowest unemployment rate for the month at 2.8%. Other counties with some of the lowest unemployment rates in October were Benton (3.4%), Washington (3.7%), and Malheur (3.9%) counties. Twelve counties had unemployment rates at or below the nationwide rate of 4.6%. Eleven of those counties also had unemployment rates at or below the statewide rate of 4.4%.
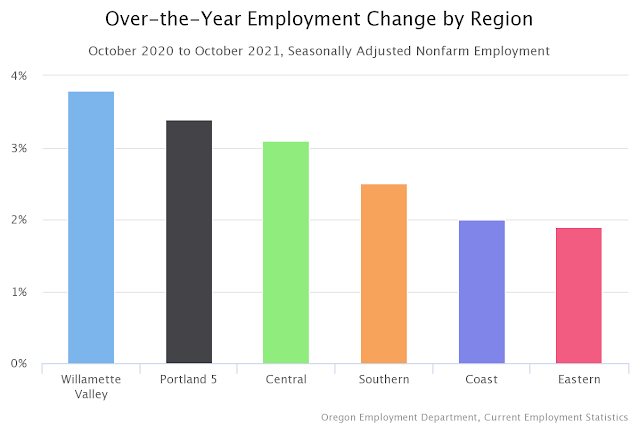
Total nonfarm payroll employment increased in all six of Oregon’s broad regions between October 2020 and October 2021. Most areas still have room to recover from pandemic job losses; the state has now recovered 74% of jobs lost in March and April 2020. The largest job increases since October 2020 occurred in the Willamette Valley (3.8%). The Portland 5 area (3.4%) and Central Oregon (3.1%) also experienced large over-the-year employment increases. Southern Oregon, the Coast, and Eastern Oregon regions added 2.5%, 2.0%, and 1.9%, respectively.
Next News Releases
The Oregon Employment Department will release statewide unemployment rate and industry employment data for November 2021 on Tuesday, Dec. 14, 2021. The November 2021 county and metropolitan area unemployment rates will be released on Tuesday, Dec. 21, 2021.
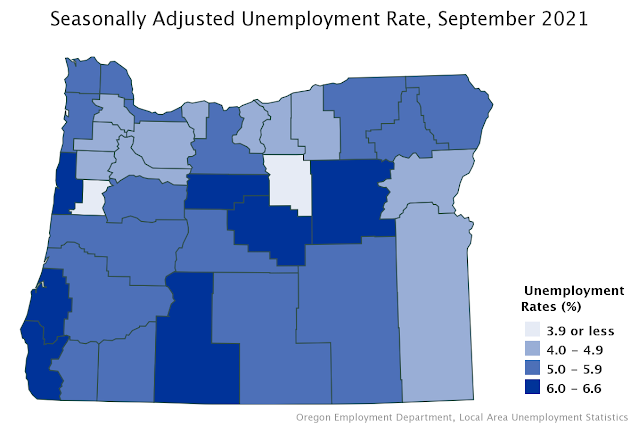
In September 2021, all but three of Oregon’s 36 counties experienced over-the-month decreases in their unemployment rates. The unemployment rates in Deschutes, Lake, and Wallowa counties remained unchanged. Lincoln County saw the largest decrease over the month with a decline of 0.4 percentage point.
Klamath and Grant counties had Oregon’s highest seasonally adjusted unemployment rate in September at 6.6%. Other counties with some of the highest unemployment rates included Lincoln (6.5%), Curry (6.5%), Crook (6.5%), and Jefferson (6.1%) counties.
Wheeler County registered the lowest unemployment rate for the month at 2.9%. Other counties with some of the lowest unemployment rates in September were Benton (3.6%), Washington (4.0%), Sherman (4.0%), and Malheur (4.1%) counties. Eleven counties had unemployment rates at or below the nationwide rate of 4.8%. The same 11 counties also had unemployment rates at or below the statewide rate of 4.7%.
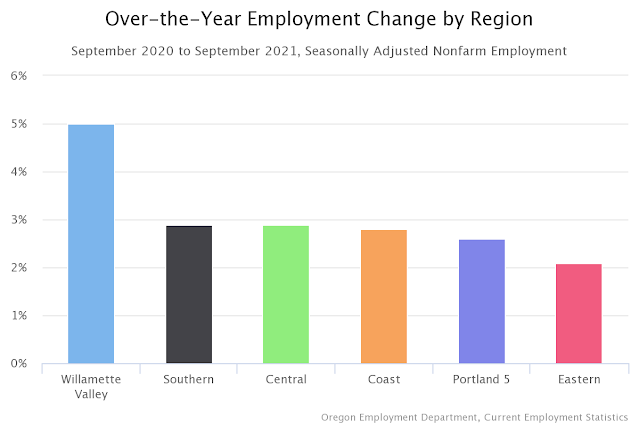
Total nonfarm payroll employment increased in all six of Oregon’s broad regions between September 2020 and September 2021. Most areas still have room to recover from pandemic job losses; the state has now recovered 72% of jobs lost in March and April 2020. The largest job increases since September 2020 occurred in the Willamette Valley (5.0%). Southern Oregon (2.9%), Central Oregon (2.9%), and the Coast (2.8%) also experienced large over-the-year employment increases. The Portland 5 and Eastern Oregon regions added 2.6% and 2.1%, respectively.
Next News Releases
The Oregon Employment Department will release statewide unemployment rate and industry employment data for October 2021 on Tuesday, Nov.16, 2021. The October 2021 county and metropolitan area unemployment rates will be released on Tuesday, Nov. 23, 2021. Read the original press release.
This morning the Employment Department released the September unemployment rate and jobs numbers for Oregon. After averaging monthly gains of 10,200 jobs from January through August, nonfarm payrolls lost 200 jobs in September.
The jobs recovery looks quite different across different areas of the economy. About half of local government payroll jobs are in public K-12 schools and higher education. In September, local government fell short of its typical hiring level by 3,700 jobs. Local government has struggled to regain jobs since the pandemic recession, only adding back about 26% of the jobs lost in spring 2020.
The hotels, restaurants, bars, and entertainment places in Oregon's leisure and hospitality sector have also struggled to get back to pre-pandemic job levels. They've been hiring at a good pace, with an average of 3,500 in monthly job gains so far in 2021. Leisure and hospitality has regained 62% of the jobs lost in spring 2020. The tremendous size of the task of adding back the 111,000 jobs lost last spring remains a challenge though -- especially during a time of record job openings and employer competition for workers.
Some industries have fully recovered and now expanded beyond their February 2020 job levels. Professional and technical services added 1,200 jobs in September. These companies, which provide a mix of architectural, engineering, computer design, and other services, had 6,000 more jobs in September than they did before the recession.
Transportation, warehousing, and utilities employment surged during 2020, which was a stark contrast to most of the rest of Oregon's economy. The sector added 1,000 jobs in September, and has 3,900 more jobs than it did before the recession. As of September, the banks, insurance, real estate and rental companies that make up the financial activities sector had also regained 99% of the jobs lost in spring 2020.
Despite the pause in overall job gains, Oregon's unemployment rate continued to improve. The rate was 4.7% in September, a significant decline from 5.0% in August. More information about Oregon's employment situation can be found in the full news release.
In July 2021, all but one of Oregon’s 36 counties experienced over-the-month decreases in their unemployment rates. The unemployment rate in Lake County experienced no over-the-month change to its unemployment rate. Jackson and Multnomah counties saw the largest decrease over the month with a change of -0.5 percentage point.
Lincoln County had Oregon’s highest seasonally adjusted unemployment rate in July at 7.2%. Other counties with some of the highest unemployment rates included Crook (7.0%), Curry (7.0%), Klamath (7.0%), and Grant (6.9%) counties.
Wheeler County registered the lowest unemployment rate for the month at 3.2%. Other counties with some of the lowest unemployment rates in July were Benton (4.1%), Malheur (4.3%), and Sherman (4.4%) counties. Fifteen counties had unemployment rates at or below the nationwide rate of 5.4%, and 12 counties had unemployment rates below the statewide rate of 5.2%.
Total nonfarm payroll employment increased in all six of Oregon’s broad regions between July 2020 and July 2021. Most areas still have room to recover from pandemic job losses; the state has now recovered 70% of jobs lost in March and April 2020. The largest job increases since July 2020 occurred on the Coast (6.2%). Southern Oregon (4.9%), the Willamette Valley (4.8%), and Central Oregon (4.6%) also experienced large over-the-year employment increases. Eastern Oregon and the Portland-5 regions added 3.6% and 3.5%, respectively.
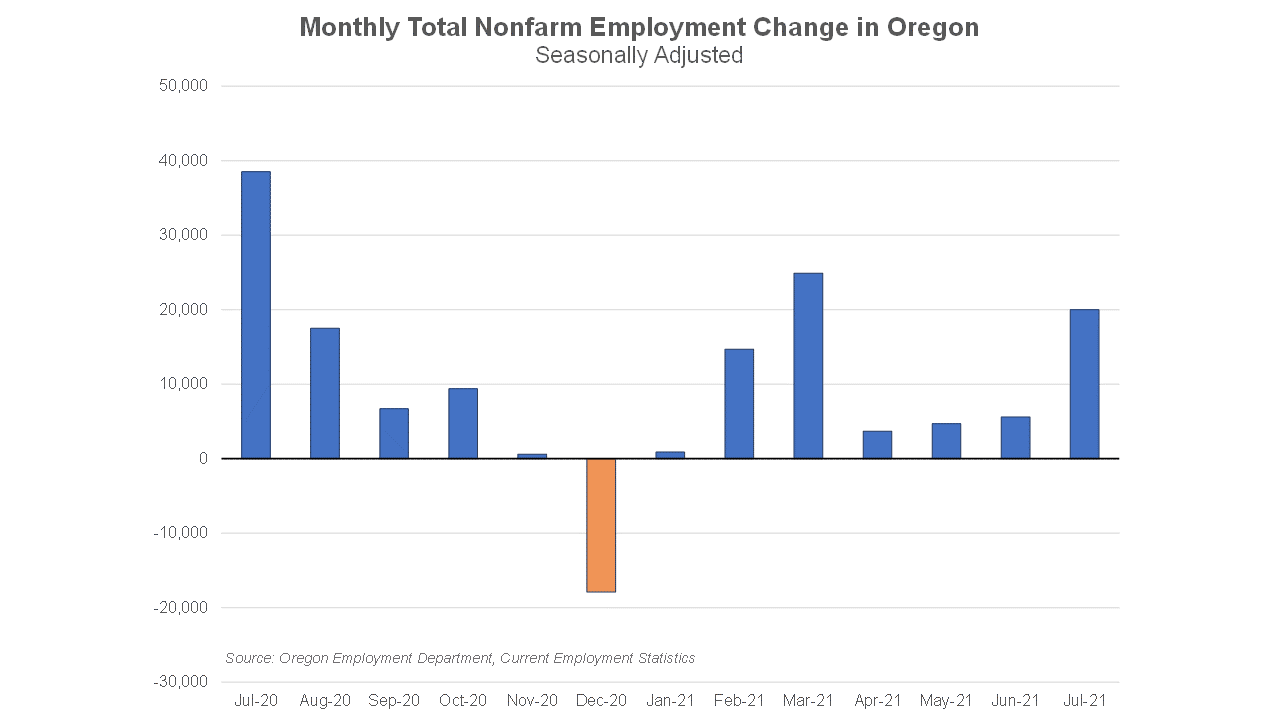
Oregon's jobs recovery strengthened in July. Oregon added 20,000 jobs to nonfarm payrolls, and the unemployment rate dropped significantly to 5.2%.
Leisure and hospitality added 7,100 jobs in July. That means one out of three jobs added over the month was at Oregon's restaurants, hotels, and entertainment places. In the first seven months of 2021, Oregon's leisure and hospitality sector added as many jobs as it did in five years (61 months) leading up to the pandemic.
Government added 12,800 jobs in July. These were related
to public education. School employment was already much lower than
normal in July, and they had fewer layoffs than we'd generally expect
this time of year. When we expect schools to let go of bus drivers and
cafeteria workers for the summer, but there were already not as many
working at schools recently, it can look like a big gain.
Oregon's
unemployment rate improved from 5.6% in June to 5.2% in July. This was a
significant drop that happened because many unemployed people found
jobs over the month. Oregon's unemployment rate hit its all-time peak of
13.2% in April 2020. In the 15 months since then, the rate has fallen
by 8.0 percentage points.
More information about Oregon's employment situation is available in thefull news release, or in the video recap.
In June 2021, all but two of Oregon’s counties experienced over-the-month decreases in their unemployment rates. The unemployment rate in Sherman County did not change, and in Lake County it increased by 0.1 percentage point. Clatsop, Multnomah, and Wheeler counties saw the largest decrease over the month with a change of -0.4 percentage points.
Lincoln County had Oregon’s highest seasonally adjusted unemployment rate in June at 7.7%. Other counties with some of the highest unemployment rates included Crook (7.4%), Curry (7.3%), Klamath (7.2%), and Grant (7.2%) counties.
Wheeler County registered the lowest unemployment rate for the month at 3.5%. Other counties with some of the lowest unemployment rates in June were Benton (4.4%), Sherman (4.6%), and Malheur (4.6%) counties. Nineteen counties had unemployment rates at or below the nationwide rate of 5.9%, and 14 counties had unemployment rates below the statewide rate of 5.6%.
Total nonfarm payroll employment increased in all six of Oregon’s broad regions between June 2020 and June 2021. Most areas still have room to recover from pandemic job losses; the state has now recovered 64% of jobs lost in March and April 2020. The largest job increases since June 2020 occurred on the Coast (7.1%). Central Oregon (6.5%), the Willamette Valley (5.2%), and Eastern Oregon (4.4%) also experienced large over-the-year employment increases. Southern Oregon and the Portland-5 regions added 3.8% and 3.5%, respectively.
Oregon's unemployment rate continued its gradual improvement in 2021, dropping to 5.6% in June. This reflects more Oregonians getting back on the job. Nonfarm payrolls added 7,500 jobs in June.
Oregon has regained 64% of the jobs lost in spring 2020, compared with 70% for the U.S. While that still leaves quite a gap to return to pre-pandemic employment levels, the pace of hiring has been relatively fast in 2021. Oregon added 57,800 jobs in the first half of the year. Leading up to the pandemic, it took 22 months for Oregon to add about that many jobs.
In June, private health care and social assistance added the most jobs (+2,400). Other services -- which includes barber shops, hair salons, repair services, and others -- added 1,700 jobs over the month. Leisure and hospitality resumed hiring, adding 1,000 jobs.
While most sectors still have fewer jobs than before the pandemic, two private industries have more jobs now than they did in February 2020. Transportation, warehousing, and utilities is 4,400 jobs (or 6%) above its pre-pandemic employment level. Professional and technical services employs 3,100 (or 3%) more than before the pandemic recession.
Nonfarm payroll employment rose 20,100 jobs in March, following a gain of 15,300, as revised, in
February. Two-thirds of all the jobs gained in March were in leisure and hospitality (+13,900 jobs).
Three other major industries each added more than 1,000 jobs: manufacturing (+2,000 jobs);
professional and business services (+1,300); and transportation, warehousing, and utilities
(+1,100). Construction and private educational services each added 700 jobs. All other major
industries performed close to their normal seasonal patterns.
The 20,100 total nonfarm jobs added in March was Oregon’s largest monthly gain since 38,300 jobs
were added in July. March’s gain was the third monthly increase, following a large drop in December
that was the result of temporary, heightened restrictions at the time.
In March, Oregon’s nonfarm payroll employment totaled 1,840,600, a drop of 132,400 jobs, or 6.7%
from the pre-recession peak in February 2020. Oregon’s employment dropped to a low of 1,687,500 by
April 2020. Since then, Oregon has recovered 153,100 jobs, or 54% of the jobs lost between February
and April 2020.
Oregon’s unemployment rate edged down to 6.0% in March, from 6.1% in February. For the past three months, Oregon’s unemployment rate has ticked down by a tenth of a point each month. During the past 11 months the pace of recovery in Oregon’s unemployment rate has mirrored the national experience. The U.S. unemployment rate dropped to 6.0% in March, from 6.2% in February.
In February 2021, 25 out of 36 of Oregon’s counties experienced over-the-month decreases in their unemployment rates. Tillamook and Lincoln counties saw the largest over-the-month decrease, declining 0.5 percentage point each in February.
Clatsop County had Oregon’s highest seasonally adjusted unemployment rate in February at 8.1%. Other counties with some of the highest unemployment rates included Lincoln (8.0%), Crook (8.0%), Curry (7.1%), and Union (7.1%).
Wheeler County registered the lowest unemployment rate for the month at 3.7%. Other counties with some of the lowest unemployment rates in February were Sherman (4.1%), Malheur (4.5%), and Lake (4.5%). Nineteen counties had unemployment rates at or below the statewide rate of 6.1%. Twenty counties also had unemployment rates at or below the nationwide rate of 6.2%.
Total nonfarm payroll employment declined in all six of Oregon’s broad regions between February 2020 and February 2021. The largest job losses occurred in the Portland-5 (-9.6%). The Coast (-7.8%), the Willamette Valley (-7.4%), and Central Oregon (-5.5%) also experienced large over-the-year employment losses. Southern Oregon and Eastern Oregon came in at -4.6% and -2.9%, respectively.
Next News Releases
The Oregon Employment Department will release statewide unemployment rate and industry employment data for March 2021 on Tuesday, April 13, 2021. The March 2021 county and metropolitan area unemployment rates will be released on Tuesday, April 20, 2021.
In January 2021, 16 out of 36 of Oregon’s counties experienced over-the-month increases in their unemployment rates. Oregon’s unemployment rate decreased by 0.1 percentage point between December and January, and 14 of Oregon’s counties followed the state with a decline of 0.1 percentage point or more. Deschutes and Grant counties saw the largest over-the-month decrease, declining 0.6 percentage point in January.
Lincoln and Clatsop counties had Oregon’s highest seasonally adjusted unemployment rates in January at 8.1% each. Other counties with some of the highest unemployment rates included Crook (7.8%), Curry (7.3%), and Multnomah (7.2%).
Wheeler County registered the lowest unemployment rate for the month at 4.2%. Other counties with some of the lowest unemployment rates in January were Malheur (4.3%) and Sherman (4.3%). Twenty-two counties had unemployment rates at or below the statewide rate of 6.2%. The same number of counties also had unemployment rates at or below the nationwide rate of 6.3%.
Total nonfarm payroll employment declined in all six of Oregon’s broad regions between January 2020 and January 2021. The largest job losses occurred in the Portland-5 (-9.3%). The Willamette Valley (- 7.5%), the Coast (-7.4%), and Central Oregon (-6.0%) also experienced large over-the-year employment losses. Southern Oregon and Eastern Oregon came in at -3.2% and -2.2%, respectively.
Next News Releases
The Oregon Employment Department will release statewide unemployment rate and industry employment data for February 2021 on Tuesday, March 16, 2021. The February 2021 county and metropolitan area unemployment rates will be released on Tuesday, March 30, 2021.
According to the Oregon Encyclopedia, “Oregon's racial makeup has been shaped by three black exclusion laws that were in place during much of the region's early history. These laws, all later rescinded, largely succeeded in their aim of discouraging free blacks from settling in Oregon early on, ensuring that Oregon would develop as primarily white.”
Though only a small share of the state’s population, Oregon’s Black population is diverse, young, and has grown quickly over the last 10 years.Black Oregonians have achieved higher levels of educational attainment over the past decade and have experienced better economic outcomes including higher labor force participation, lower unemployment rates, and higher earnings. However, large disparities in labor market outcomes between Black people and all in Oregon persist and may worsen in the short term during the COVID-19 pandemic recession, as research from the Federal Reserve Bank of San Francisco shows that relative labor market outcomes for Black people improve under tight labor market conditions and worsen during recessions. Here, we will take a look at relative employment outcomes for Oregon's Black residents over the past decade from 2010 to 2019.
Labor Market Outcomes
The Black population’s labor force participation rate has increased to become higher than for the state’s overall population, driven in part by increased levels of educational attainment in the Black community and overall improving labor market conditions. However, Black Oregonians continue to suffer from a significantly higher unemployment rate at 9.0% compared to 5.5% for all in Oregon’s labor force on average from 2015 to 2019.
Achieving higher levels of educational attainment may help Black people improve their individual employment outcomes, but national data show that Black people still face unemployment rates nearly twice as high compared with all in the labor force across all levels of educational attainment.
Along with improving educational attainment, unemployment and labor force participation rates, real average annual wages for Black workers in Oregon have increased by 18.1% over the decade to $47,500 in 2019. The rate of growth has been faster than the 14.6% wage growth that was experienced across all workers during this period. Nevertheless, average annual earnings for Black workers were 15.0% lower (or $8,412) than earnings for all workers as of 2019.
Wage gaps between Black workers and all others are persistent across all levels of educational attainment for full-time, year-round workers over the age of 25. The largest wage gap occurs at the highest end of the educational attainment spectrum, with Black workers in Oregon with advanced or professional degrees earning median wages roughly $12,000 less than their equally educated peers from 2015 to 2019. Black workers with some college or an associate degree statewide earned essentially the same median wage ($37,000) as workers of all others combined with a high school diploma or equivalent ($40,000). Oregon’s broad trends are consistent with national-level data, with the Black workers earning lower median annual wages ranging from $2,700 less for those with less than a high school diploma to $17,000 less for those with an advanced or professional degree compared with all other workers with the same levels of educational attainment nationally.
Wages consistently increase along with educational attainment for both groups of workers nationally and statewide. Black workers in Oregon with some college or an associate degree, a bachelor’s degree, and an advanced or professional degree earned a median wage of $37,000, $56,000, and $68,000 respectively from 2015 to 2019. Median annual wages were $19,000 (51%) higher for Black workers with a bachelor’s degree compared to those with some college or an associate degree.
Factors like age, gender, and occupation are hard to control for in Oregon due to sample size limitations that affect data reliability, but national data show that none of these factors can completely explain why an earnings gap exists. The Federal Reserve Bank of Minneapolis explains in a study of their own labor market that, “Unequal labor market outcomes are not a consequence of the labor market alone but also reflect the institutionalization of systemic racism through less opportunity in education, housing, location, and the criminal justice system.”
Eradicating economic disparities between marginalized groups of people will increase the U.S.’s overall economic output and improve the lives of individuals and families. To keep moving forward towards better economic outcomes, a combination of individual and policy-level efforts are necessary. Individuals can increase their earnings and decrease their likelihood of becoming unemployed through education and training efforts. Key federal agencies such as the Federal Reserve Bank of America can act in ways that promote economic recovery and expansion for longer periods of time, and state and local government can ensure their policies are inclusive of everyone in their communities. Businesses also have a role to play by examining and improving their policies related to the hiring, retention, and promotion of workers.
In November 2020, all of Oregon’s 36 counties experienced over-the-month decreases in their unemployment rates. In 33 counties, unemployment rates dropped by half a percentage point or more. Lincoln, Josephine, and Sherman counties experienced the largest over-the-month decreases at 1.1 percentage points each.
Lincoln County had Oregon’s highest seasonally adjusted unemployment rate in November at 7.4%. Other counties with some of the highest unemployment rates include Crook (7.2%), Multnomah (7.2%), and Grant (7.0%).
Wheeler County registered the lowest unemployment rate for the month at 3.9%. Other counties with some of the lowest unemployment rates in November were Benton (4.2%), Morrow (4.3%), and Sherman (4.3%). Twenty-two counties had unemployment rates at or below the statewide rate of 6.0%. Thirty-two counties also had unemployment rates at or below the nationwide rate of 6.7%.
Total nonfarm payroll employment declined sharply in all six of Oregon’s broad regions between November 2019 and November 2020. The largest job losses occurred in the Portland-5 (-9.8%). The Coast (-8.1%), Willamette Valley (-7.7%), and Central Oregon (-5.5%) also experienced large over-the-year employment losses.
Next News Releases
The Oregon Employment Department will release statewide unemployment rate and industry employment data for December 2020 on Wednesday, Jan. 20, 2021. The December 2020 county and metropolitan area unemployment rates will be released on Tuesday, Jan. 26, 2021.
Oregon’s unemployment rate dropped to 6.9 percent in October
from 7.9 percent, as revised, in September. For the past few months, Oregon’s
unemployment rate has closely tracked the national unemployment rate which also
fell to 6.9 percent in October from 7.9 percent in September.
Oregon’s total nonfarm payroll employment rose by 14,200
jobs in October, following a revised gain of 9,300 jobs in September. Over the
past four months the rate of job growth has averaged 14,400 per month,
following more rapid growth in May and June, when 74,500 jobs were added. Oregon
employers added jobs in each of the past six months, and the state has
recovered 46 percent of the jobs cut in March and April.
Over-the-month job gains in October were largest in construction (+6,100 jobs), professional and business services
(+4,300), and leisure and hospitality
(+4,300). Declines were largest in government
(-7,400 jobs).
Leisure and
hospitality continues to be the industry most impacted by the economic
effects of the COVID-19 pandemic. Its employment bounced back substantially in
May and June, but job gains have slowed over the past four months. Employment
totaled 162,000 in October, which was down 54,300 jobs, or 25 percent, since
its peak month of February. Over the past 12 months, two of its component
industries cut employment by more than a quarter. Since October 2019 arts, entertainment, and recreation is
down by nearly half (-13,000 jobs, or -49 percent) and accommodation is down by nearly a third (-8,600 jobs, or -32
percent).
Most schools in Oregon were impacted by a combination of
distance learning and declining enrollment this autumn, which resulted in job
cuts at all levels of education. When comparing October 2020 with October 2019,
all of education—from grade schools to colleges—have experienced job
reductions. Local government education
reduced employment to 118,700 in October from 139,900 in October 2019 (-21,200
jobs, or -15%). This industry includes local K-12 schools, community colleges
and the Oregon University System. Private
education, which includes private grade schools and private universities,
cut 7,400 jobs, or 20 percent, since October 2019.
Two major industries expanded since October 2019. Construction surged by 6,100 jobs over the
month in October and is up 700 jobs since October 2019, putting it close to its
record levels during late 2019 through March 2020. Transportation, warehousing, and utilities added 1,200 jobs in
October and grew fast for most of the past few years, adding 5,800 jobs over
the past 12 months. The industry benefitted from rapid demand growth in online
shopping and the resulting expansion of warehousing and distribution.
In September 2020, 31 of Oregon’s 36 counties experienced over-the-month decreases in their unemployment rates. In 19 counties, unemployment rates dropped by half a percentage point or more. Multnomah and Jefferson counties experienced the largest over-the-month decreases at 1.1 percentage point each. Over-the-month unemployment rates remained unchanged in four counties: Jackson, Linn, Lake, and Wheeler. Douglas County saw a slight increase in its unemployment rate over the month (+0.2pp).
Lincoln County had Oregon’s highest seasonally adjusted unemployment rate in September at 10.6 percent. Other counties with some of the highest unemployment rates include Multnomah (9.5%), and Crook (9.1%).
Wheeler County registered the lowest unemployment rate for the month at 4.4 percent. Other counties with some of the lowest unemployment rates in September were Morrow (5.3%) and Benton (5.6%). Twenty-two counties had unemployment rates at or below the statewide rate of 8.0 percent. Twenty-one counties also had unemployment rates at or below the nationwide rate of 7.9 percent. Total nonfarm payroll employment declined sharply in all six of Oregon’s broad regions between September 2019 and September 2020. The largest job losses occurred in the Coast region (-9.6%). Portland-5 (-8.2%), Central Oregon (-7.3%), and the Willamette Valley (-6.9%) also experienced large over-the-year employment losses. Read the original press release here.
Oregon’s unemployment rate dropped to 8.0 percent in September from 8.5 percent, as revised, in August. For the past few months, Oregon’s unemployment rate has closely tracked the national unemployment rate which fell to 7.9 percent in September from 8.4 percent in August.
Oregon’s total nonfarm payroll employment rose by 5,100 jobs in September, following a revised gain of 16,200 jobs in August. Over the past three months the rate of job growth slowed, with 39,000 jobs added in that time, following more rapid growth in May and June, when 83,100 jobs were added. Despite the recent slowdown, Oregon employers added jobs in each of the past five months, and the state has recovered 45 percent of the jobs cut in March and April.
Over-the-month job gains in September were largest in leisure and hospitality (+2,600 jobs); financial activities (+1,600); health care and social assistance (+1,600); retail trade (+1,500); and information (+1,200). Two industries cut a substantial number of jobs in September: construction (-2,600 jobs) and private educational services (-1,400).
Leisure and hospitality continues to be the industry most impacted by the economic effects of the COVID-19 pandemic. Its employment bounced back substantially in May and June, but job gains have slowed over the past three months. Employment totaled 163,200 in September, which was down 53,400 jobs, or 24.7%, since its peak month of February.
Manufacturing lost a substantial number of jobs this spring and hasn’t rebounded. Employment stood at 180,000 jobs in September, which was close to its level of the past five months. Since September 2019, manufacturing cut 18,100 jobs with losses widespread throughout most component industries. During that time, primary metals manufacturing dropped the most in percentage terms, shedding 2,600 jobs, or 28 percent. Next in line was transportation equipment manufacturing which cut 19 percent. Two other manufacturing industries dropped at least 10 percent: food manufacturing (-4,200 jobs, or -14%) and electronic instrument manufacturing (-600 jobs, or -11%). None of the published manufacturing industries added a substantial number of jobs over the past 12 months.
In contrast, two major industries rose closer to pre-pandemic employment levels. Retail trade rebounded rapidly, adding 4,700 jobs over the past two months. This left the industry down only 4,800 jobs, or 2.3 percent, since February. Certain retailers responded to strong demand lately, with food and beverage stores up 900 jobs, or 2.1 percent, since last September. Similarly, building material and garden supply stores added 900 jobs, or 5.4 percent in that time, while general merchandise stores added 1,100 jobs or 2.7 percent. Clearly consumer preferences and demands have shifted substantially, as reflected by job losses in several categories including clothing stores, which cut 8,100 jobs, or 51.6 percent, over the year, and miscellaneous store retailers, which shed 2,800 jobs, or 16.5 percent.
Health care and social assistance added 2,300 jobs over the past two months and was only 8,200 jobs, or 3.1 percent, below its recent high in February. Over the past 12 months, social assistance cut 4,900 jobs, or 8.4 percent. However, health care declined only 800 jobs in that time.