In June, unemployment rates declined in 18 of Oregon’s 36 counties. Unemployment rates in 17 counties did not decline, but held steady over the month. The unemployment rate increased in Umatilla County. Fourteen counties had unemployment rates at or below the statewide and nationwide rate of 3.6% in June.
Klamath and Grant counties had Oregon’s highest seasonally adjusted unemployment rate (5.2%) in June. Other counties with relatively high unemployment rates were Curry (4.8%), Crook (4.7%), Josephine (4.7%), and Lincoln (4.7%). Wheeler County registered the lowest unemployment rate (2.8%) in June. Other counties with some of the lowest unemployment rates in June included Benton, Hood River, Sherman, and Washington, at 2.9% each.
Between June 2021 and June 2022, total nonfarm employment rose in each of the six broad regions across Oregon. The Willamette Valley region experienced the fastest job growth over the year at 3.8%. Employment also grew at a relatively fast pace in the five Portland-metro counties (3.4%) and Central Oregon region (3.3%). Growth occurred at a slower pace along the Coast (1.6%), in Southern Oregon (0.7%), and in Eastern Oregon (0.5%).
Next News Releases
The Oregon Employment Department will release statewide unemployment rate and industry employment data for July 2022 on Wednesday, Aug. 17, 2022. The July 2022 county and metropolitan area unemployment rates will be released on Tuesday, Aug. 23, 2022.
In February 2022, 35 of Oregon’s 36 counties experienced over-the-month decreases in their unemployment rates. Wheeler County experienced no over-the-month change in its unemployment rate. Five counties experienced a 0.3 percentage point decrease or more over the month including Gilliam, Grant, Hood River, Jefferson, and Union counties.
Klamath County had Oregon’s highest seasonally adjusted unemployment rate in February at 5.5%. Other counties with some of the highest unemployment rates included Grant (5.4%), Curry (5.3%), Crook (5.2%), and Lincoln (5.2%).
Benton and Wheeler counties registered the lowest unemployment rate for the month at 3.0% each. Other counties with some of the lowest unemployment rates in February were Hood River (3.2%), Washington (3.3%), and Sherman (3.4%). Sixteen counties had unemployment rates at or below the statewide rate of 4.0%. Twelve counties also had unemployment rates at or below the nationwide rate of 3.8%.
Total nonfarm payroll employment increased in all six of Oregon’s broad regions between February 2021 and February 2022. Central Oregon has recovered from pandemic job losses. All other areas still have room to recover. The largest job increases since February 2021 occurred in the Central Oregon (5.5%) region. The Portland 5 (5.3%) and Willamette Valley (4.1%) regions also experienced large over-the-year employment increases. Growth occurred at a slower pace in other regions: Eastern Oregon (3.1%), Southern Oregon (1.8%), and the Coast (1.6%).
Next News Releases The Oregon Employment Department will release statewide unemployment rate and industry employment data for March 2022 on Wednesday, April 13, 2022. The March 2022 county and metropolitan area unemployment rates will be released on Tuesday, April 19, 2022.
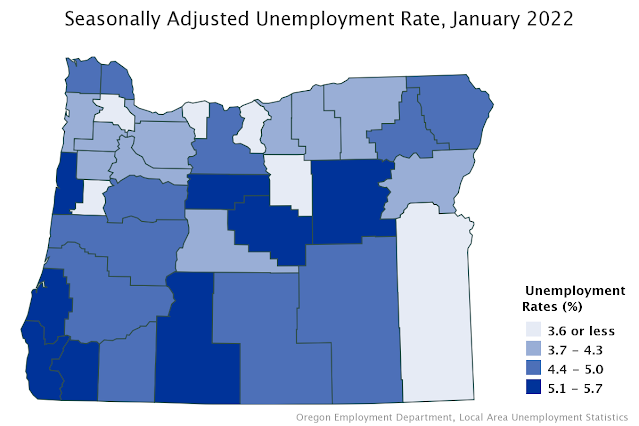
In January 2022, 25 of Oregon’s 36 counties experienced over-the-month decreases in their unemployment rates. Five counties experienced a 0.2 percentage point decrease or more over the month including Clatsop, Deschutes, Grant, Harney, and Jefferson counties.
Grant County had Oregon’s highest seasonally adjusted unemployment rate in January at 5.7%. Other counties with some of the highest unemployment rates included Klamath (5.6%), Crook (5.5%), Curry (5.5%), and Lincoln (5.4%).
Wheeler County registered the lowest unemployment rate for the month at 3.0%. Other counties with some of the lowest unemployment rates in January were Benton (3.1%), Washington (3.4%), and Hood River (3.5%). Seventeen counties had unemployment rates at or below the statewide rate of 4.3%. Twelve counties also had unemployment rates at or below the nationwide rate of 4.0%.
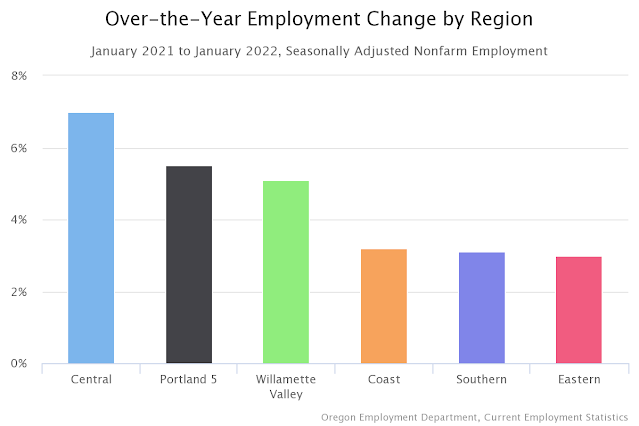
Total nonfarm payroll employment increased in all six of Oregon’s broad regions between January 2021 and January 2022. Most areas still have room to recover from pandemic job losses. The largest job increases since January 2021 occurred in the Central Oregon (7.0%) region. The Portland 5 (5.5%) and Willamette Valley (5.1%) regions also experienced large over-the-year employment increases. Growth occurred at a slower pace in other regions: the Coast (3.2%), Southern Oregon (3.1%), and Eastern Oregon (3.0%).
Next News Releases
The Oregon Employment Department will release statewide unemployment rate and industry employment data for February 2022 on Tuesday, March 22, 2022. The February 2022 county and metropolitan area unemployment rates will be released on Tuesday, March 29, 2022. Read the original press release here.
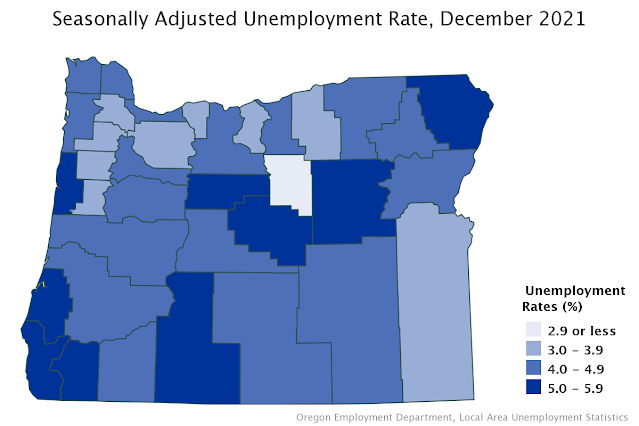
In December 2021, all of Oregon’s 36 counties experienced over-the-month decreases in their unemployment rates. Eight counties experienced a 0.3 percentage point decrease or more over the month including Clatsop, Crook, Deschutes, Grant, Hood River, Jefferson, Klamath, and Wasco counties.
Grant County had Oregon’s highest seasonally adjusted unemployment rate in December at 5.9%. Other counties with some of the highest unemployment rates included Klamath (5.7%), Crook (5.6%), Curry (5.6%), and Lincoln (5.5%).
Wheeler County registered the lowest unemployment rate for the month at 2.8%. Other counties with some of the lowest unemployment rates in December were Benton (3.1%), Washington (3.4%), and Hood River (3.6%). Twelve counties had unemployment rates at or below the statewide rate of 4.1%. Ten counties also had unemployment rates at or below the nationwide rate of 3.9%.
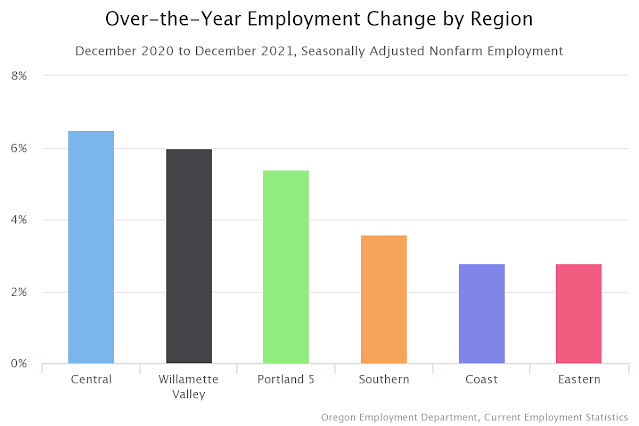
Total nonfarm payroll employment increased in all six of Oregon’s broad regions between December 2020 and December 2021. Most areas still have room to recover from pandemic job losses. The largest job increases since December 2020 occurred in the Central Oregon (6.5%) region. The Willamette Valley (6.0%) and Portland 5 area (5.4%) also experienced large over-the-year employment increases. Southern Oregon, the Coast, and Eastern Oregon regions added 2.6%, 2.8%, and 2.8%, respectively.
Next News Releases The Oregon Employment Department will release statewide unemployment rate and industry employment data for January 2022 on Tuesday, March 8, 2022. The January 2022 county and metropolitan area unemployment rates will be released on Tuesday, March 8, 2022.
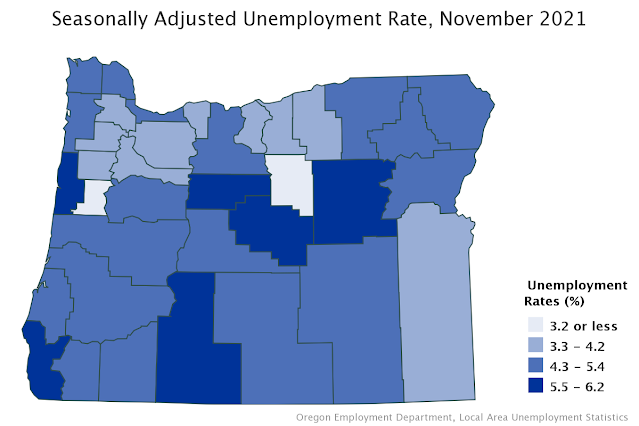
In November 2021, 35 of Oregon’s 36 counties experienced over-the-month decreases in their unemployment rates. Seventeen counties experienced a 0.3 percentage point decrease or more over the month including Baker, Clackamas, Clatsop, Coos, Crook, Curry, Gilliam, Klamath, Multnomah, Tillamook, Union, Wasco, Yamhill, Hood River, Deschutes, Lane, and Lincoln counties.
Grant County had Oregon’s highest seasonally adjusted unemployment rate in November at 6.2%. Other counties with some of the highest unemployment rates included Klamath (6.0%), Crook (5.9%), Curry (5.8%), and Lincoln (5.7%).
Wheeler County registered the lowest unemployment rate for the month at 2.8%. Other counties with some of the lowest unemployment rates in November were Benton (3.2%); Washington (3.5%); and Clackamas, Malheur, Sherman, and Yamhill (3.8% each). Twelve counties had unemployment rates at or below the nationwide and statewide rate of 4.2%.
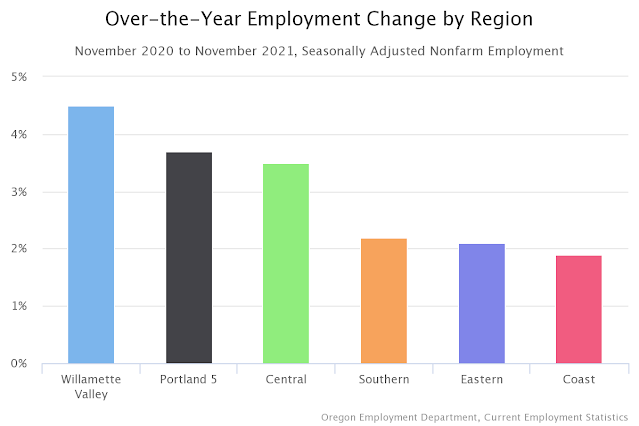
Total nonfarm payroll employment increased in all six of Oregon’s broad regions between November 2020 and November 2021. Most areas still have room to recover from pandemic job losses; the state has now recovered roughly three-quarters of jobs lost in March and April 2020. The largest job increases since November 2020 occurred in the Willamette Valley (4.5%). The Portland 5 area (3.7%) and Central Oregon (3.5%) also experienced large over-the-year employment increases. Southern Oregon, Eastern Oregon, and the Coast regions added 2.2%, 2.1%, and 1.9%, respectively.
Next News Releases
The Oregon Employment Department will release statewide unemployment rate and industry employment data for December 2021 on Wednesday, Jan. 19, 2021. The December 2021 county and metropolitan area unemployment rates will be released on Tuesday, Jan. 25, 2021.
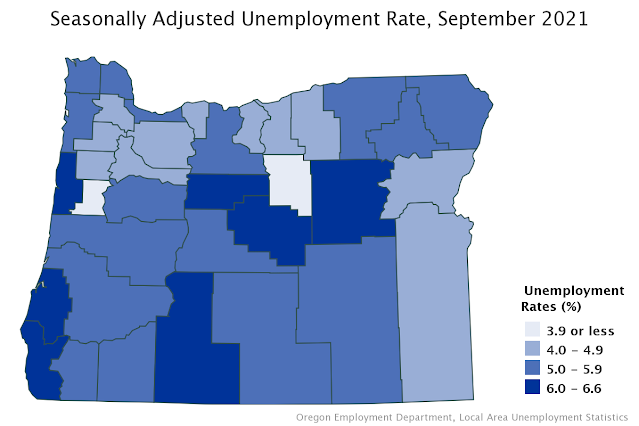
In September 2021, all but three of Oregon’s 36 counties experienced over-the-month decreases in their unemployment rates. The unemployment rates in Deschutes, Lake, and Wallowa counties remained unchanged. Lincoln County saw the largest decrease over the month with a decline of 0.4 percentage point.
Klamath and Grant counties had Oregon’s highest seasonally adjusted unemployment rate in September at 6.6%. Other counties with some of the highest unemployment rates included Lincoln (6.5%), Curry (6.5%), Crook (6.5%), and Jefferson (6.1%) counties.
Wheeler County registered the lowest unemployment rate for the month at 2.9%. Other counties with some of the lowest unemployment rates in September were Benton (3.6%), Washington (4.0%), Sherman (4.0%), and Malheur (4.1%) counties. Eleven counties had unemployment rates at or below the nationwide rate of 4.8%. The same 11 counties also had unemployment rates at or below the statewide rate of 4.7%.
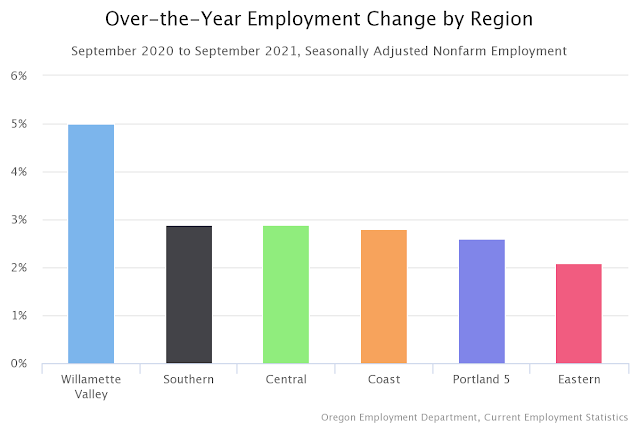
Total nonfarm payroll employment increased in all six of Oregon’s broad regions between September 2020 and September 2021. Most areas still have room to recover from pandemic job losses; the state has now recovered 72% of jobs lost in March and April 2020. The largest job increases since September 2020 occurred in the Willamette Valley (5.0%). Southern Oregon (2.9%), Central Oregon (2.9%), and the Coast (2.8%) also experienced large over-the-year employment increases. The Portland 5 and Eastern Oregon regions added 2.6% and 2.1%, respectively.
Next News Releases
The Oregon Employment Department will release statewide unemployment rate and industry employment data for October 2021 on Tuesday, Nov.16, 2021. The October 2021 county and metropolitan area unemployment rates will be released on Tuesday, Nov. 23, 2021. Read the original press release.
The transportation and warehousing sector includes many modes of travel,
in addition to the mail and deliveries that come to our doors. During
the pandemic recession, years of gains in some types of transportation
were reversed, as staying home became the norm. At the same time, the
pandemic intensified what was already an increasing reliance on
deliveries and the distribution system that gets them to us. As a
result, this broad sector’s employment is surging, in stark contrast to
the slow overall employment recovery from the pandemic recession.
By Air Not all portions of transportation and warehousing have seen their employment soar. After adding nearly 1,700 jobs between 2013 and 2019, air transportation lost 600 (-11%) jobs through the first three quarters of 2020. The airlines classified in this subsector have struggled through the pandemic. Similarly, support services for transportation -- which includes airports -- declined by 9% between 2019 and the first three quarters of 2020.
Over the Road For now, truck transportation remains the largest piece of the overall transportation and warehousing sector. Its employment has seen little change in recent years, but did decline by 3% to an average of 18,400 jobs between 2019 and the first three quarters of 2020.
By comparison, the transit and ground transportation subsector saw much more job movement over the years. After growing from 9,900 jobs to 12,300 (24%) between 2009 and 2019, transit and ground transportation fell to an average of 10,600 jobs (-13%) in the first three quarters of 2020.
While there was undoubtedly decline in these operations due to reduced travel, the available data can’t fully represent the trends in this industry. That’s because ride-hailing and gig-type food delivery services are not included in covered employment statistics. The nonemployer statistics related to transit and ground passenger transportation show an increase of 10,000 (or 774%) from 2009 to 2018. Nearly all that growth occurred in taxi and limousine services.
More to Your Door Two subsectors of transportation and
warehousing carry correspondence, care packages, and other deliveries
door to door: couriers and messengers, and the postal service. For
years, the private couriers and messengers subsector has shown a
distinctive and increasing seasonal pattern. They tend to ramp up hiring
in the fourth quarter, hitting an employment peak each December.
In
addition to more December deliveries, couriers and messengers
businesses have also been hiring to meet greater demand for online
shopping and deliveries to our doors year round. From 2009 to 2019,
annual average employment grew by 4,300 jobs, or 69%. The global
pandemic intensified this trend. Fleets of big brown trucks, gray vans,
local grocers, and their counterparts collectively added 1,500 jobs
(14%) between 2019 and the first three quarters of 2020.
Warehousing and Storage While
the gray vans, brown trucks, and mail carriers give visuals in the
neighborhood, they’re fueled by rapid growth in the warehousing and
storage subsector. Just between 2018 and the first three quarters of
2020, employment grew by 8,200 jobs to 18,100. That’s an 82% increase
and does not yet include the peak holiday delivery season for 2020.
While the big, public announcements of new Amazon operations play a role
here, big box stores with warehousing and storage operations have grown
recently too.
Given the continued growth of e-commerce,
particularly during the holidays, and the expanding presence of Amazon
in Oregon and elsewhere, the 2019 to 2029 growth outlook for both
couriers and messengers (22%) and warehousing and storage (27%) is
strong. By comparison, Oregon’s anticipated total employment growth will
be 9%.
More information about Oregon's transportation and warehousing industry can be found in the full article.
Oregon’s unemployment rate dropped to 6.0% in November from 6.8%, as revised, in October. This put Oregon’s rate below the U.S. unemployment rate which dropped to 6.7% in November from 6.9% in October.
“On Nov. 18th, Oregon implemented a ‘freeze’ to combat the rise of COVID-19 in the state. This employment press release covers Oregon’s employment situation just prior to the ongoing freeze, which has affected employers and tens of thousands of workers in recent weeks,” said Gail Krumenauer, State Employment Economist with the Oregon Employment Department.
Oregon’s total nonfarm payroll employment rose by 4,200 jobs in November, following a revised gain of 9,800 jobs in October. Oregon employers added jobs in each of the past seven months, and the state has recovered 46% of the jobs cut in March and April. Over the past five months the rate of job growth slowed. Monthly growth averaged 9,600 jobs in September and October, while more rapid gains averaging 17,000 per month occurred in July and August.
Over-the-month job gains in November were largest in transportation, warehousing, and utilities (+3,100 jobs); professional and business services (+2,600); manufacturing (+1,700); and health care and social assistance (+1,500). Monthly losses were concentrated in construction (-2,300 jobs); government (-1,800); and retail trade (-1,100).
Transportation, warehousing, and utilities added the most jobs in November and was the only major industry to add jobs since November 2019. Online shopping is booming and the industry has hired thousands of workers to keep up with demand in warehouses and for delivery drivers. The industry is up 7,500 jobs, or 10.3%, since November 2019.
Leisure and hospitality added 300 jobs in November, following a revised gain of 3,300 in October. However, these gains recovered only a fraction of the 110,500 jobs cut in March and April. The industry—which is includes restaurants, bars, motels, and arts, entertainment, and recreation employers—has been the hardest hit industry due to the pandemic. In November, it employed 161,300 in Oregon, nearly 25% fewer than in November 2019 when it employed 214,900.
Next Press Releases The Oregon Employment Department plans to release the November county and metropolitan area unemployment rates on Tuesday, Dec. 22nd, and the next statewide unemployment rate and employment survey data for December on Wednesday, Jan. 20th.
In October 2020, all of Oregon’s 36 counties experienced over-the-month decreases in their unemployment rates. In 32 counties, unemployment rates dropped by half a percentage point or more. Lincoln County experienced the largest over-the-month decrease at 1.9 percentage points.
Lincoln County had Oregon’s highest seasonally adjusted unemployment rate in October at 8.7 percent. Other counties with some of the highest unemployment rates include Multnomah (8.3%) and Crook (8.0%).
Wheeler County registered the lowest unemployment rate for the month at 4.1 percent. Other counties with some of the lowest unemployment rates in October were Morrow (5.1%) and Malheur (5.2%). Twenty-one counties had unemployment rates at or below the statewide rate of 6.9 percent. Twenty-one counties also had unemployment rates at or below the nationwide rate of 6.9 percent.
Total nonfarm payroll employment declined sharply in all six of Oregon’s broad regions between October 2019 and October 2020. The largest job losses occurred in the Portland-5 (-9.9%). The Coast (-7.9%), Willamette Valley (-7.6%), and Central Oregon (-5.5%) also experienced large over-the-year employment losses.
Oregon’s unemployment rate dropped to 8.0 percent in September from 8.5 percent, as revised, in August. For the past few months, Oregon’s unemployment rate has closely tracked the national unemployment rate which fell to 7.9 percent in September from 8.4 percent in August.
Oregon’s total nonfarm payroll employment rose by 5,100 jobs in September, following a revised gain of 16,200 jobs in August. Over the past three months the rate of job growth slowed, with 39,000 jobs added in that time, following more rapid growth in May and June, when 83,100 jobs were added. Despite the recent slowdown, Oregon employers added jobs in each of the past five months, and the state has recovered 45 percent of the jobs cut in March and April.
Over-the-month job gains in September were largest in leisure and hospitality (+2,600 jobs); financial activities (+1,600); health care and social assistance (+1,600); retail trade (+1,500); and information (+1,200). Two industries cut a substantial number of jobs in September: construction (-2,600 jobs) and private educational services (-1,400).
Leisure and hospitality continues to be the industry most impacted by the economic effects of the COVID-19 pandemic. Its employment bounced back substantially in May and June, but job gains have slowed over the past three months. Employment totaled 163,200 in September, which was down 53,400 jobs, or 24.7%, since its peak month of February.
Manufacturing lost a substantial number of jobs this spring and hasn’t rebounded. Employment stood at 180,000 jobs in September, which was close to its level of the past five months. Since September 2019, manufacturing cut 18,100 jobs with losses widespread throughout most component industries. During that time, primary metals manufacturing dropped the most in percentage terms, shedding 2,600 jobs, or 28 percent. Next in line was transportation equipment manufacturing which cut 19 percent. Two other manufacturing industries dropped at least 10 percent: food manufacturing (-4,200 jobs, or -14%) and electronic instrument manufacturing (-600 jobs, or -11%). None of the published manufacturing industries added a substantial number of jobs over the past 12 months.
In contrast, two major industries rose closer to pre-pandemic employment levels. Retail trade rebounded rapidly, adding 4,700 jobs over the past two months. This left the industry down only 4,800 jobs, or 2.3 percent, since February. Certain retailers responded to strong demand lately, with food and beverage stores up 900 jobs, or 2.1 percent, since last September. Similarly, building material and garden supply stores added 900 jobs, or 5.4 percent in that time, while general merchandise stores added 1,100 jobs or 2.7 percent. Clearly consumer preferences and demands have shifted substantially, as reflected by job losses in several categories including clothing stores, which cut 8,100 jobs, or 51.6 percent, over the year, and miscellaneous store retailers, which shed 2,800 jobs, or 16.5 percent.
Health care and social assistance added 2,300 jobs over the past two months and was only 8,200 jobs, or 3.1 percent, below its recent high in February. Over the past 12 months, social assistance cut 4,900 jobs, or 8.4 percent. However, health care declined only 800 jobs in that time.
Oregon’s total employment will grow by 9 percent (181,800 jobs) between 2019 and 2029, according to new projections from the Oregon Employment Department. That’s a modest job growth rate; however, many job openings are expected due to the need to replace workers who leave their occupations.
The Oregon Employment Department’s 2019-2029 employment projections are long-term projections intended to capture structural change in the economy, not cyclical fluctuations. As such, they are not intended to project the full impacts of the COVID-19 recession and its recovery.
Where Are the Job Openings Focused? Among the broad occupational groups, health care (+14.5%) tops the list for fastest-growing by 2029. Service occupations (which include protective services, building and grounds cleaning, personal appearance workers, funeral service workers, and more) rank first in most job openings. Service occupations made up 19 percent of jobs in 2019 and are projected to comprise 25 percent of the job openings over the decade.
Over this period most job openings are projected due to the need to replace workers leaving their occupations. Nine out of 10 total job openings (2.6 million) are expected due to the need to replace workers who retire, leave the labor force for other reasons, or make a major occupational change, with the remaining openings due to new or expanding businesses. Replacements overshadow growth openings in all broad occupational categories.
Detailed Occupations Occupations expected to have the most job openings include retail salespersons, cashiers, food preparation workers, waiters and waitresses, and personal care and service workers.
In terms of fastest-growing, 13 of the 20 fastest-growing occupations with 2019 employment of 1,000 or more are health care occupations and those associated with health care, including mental health. They include physician and medical assistants, nurse practitioners, substance abuse and mental health counselors, massage therapists, and home health aides. Aging baby boomers are helping to fuel much of the growth in health care occupations along with longer life expectancies and growing rates of chronic conditions.
Other top-growing occupations are related to computers, math, and business – software developers, operations research analysts, market research analysts, marketing specialists, and financial managers. On the other end of the scale, employment levels among several occupations are expected to decline. That includes parking enforcement workers, executive and legal secretaries, bank tellers, telemarketers, and medical transcriptionists.
Oregon’s total employment will grow by 181,800 jobs between 2019 and 2029, according to new projections from the Oregon Employment Department. The projections point to modest job growth between 2019 and 2029, although many job openings are expected due to the need to replace workers who leave their occupations.
In 2019, there were 2,120,000 jobs in Oregon. The 9 percent increase in employment between 2019 and 2029 includes private-sector gains of 156,400 jobs, 16,500 jobs in government, and an additional 8,900 gain in jobs for self-employed Oregonians.
Big Industries Add the Most Jobs Private health care and social assistance will add 46,300 jobs, the most of any sector statewide. It’s followed by professional and business services with 33,000 additional jobs in 2029. There may be little surprise seeing health care and professional and business services among the top industries adding jobs, as they are two of the largest industries in the state. It’s notable that in addition to their size, these are also the fastest-growing industries.
Fast growth in health care and social assistance (15%) can be attributed to the growth and aging of the state’s population. Health care will account for one out of every five new jobs created in Oregon by 2029. Within health care and social assistance, ambulatory health care services (20%), such as doctor and dentist offices, chiropractors, physical and speech therapists, and other specialists, and nursing and residential care facilities (17%) are expected to grow much faster than hospitals (10%).
Professional and business services growth (13%) will be driven by gains in professional and technical services such as computer systems design (26%) and management of companies and enterprises (18%). Management of companies and enterprises includes corporate offices headquartered in Oregon.
Construction is the third-fastest growing industry, as it is expected to grow by 11 percent between 2019 and 2029. Demand for construction will be driven by population and economic growth, low residential vacancy rates and associated rising prices. Residential building construction is expected to increase by 14 percent adding 2,600 jobs. Nonresidential building construction should increase by 12 percent adding 1,400 jobs. Building equipment contractors are projected to add 3,400 jobs, a gain of 11 percent. This includes contractors for plumbing, heating, air conditioning, electrical and other wiring installations. Building finishing contractors, which includes contractors for drywall and insulation, flooring, and finish carpentry, are projected to add 1,300 jobs (8%).
Oregon’s total employment will grow by 181,800 jobs between 2019 and 2029, according to new projections from the Oregon Employment Department. The projections point to modest job growth between 2019 and 2029, although many job openings are expected due to the need to replace workers who leave their occupations.
In 2019, there were 2,120,000 jobs in Oregon. The 9 percent increase in employment between 2019 and 2029 includes private-sector gains of 156,400 jobs, growth of 16,500 jobs in government, and an additional 8,900 self-employed Oregonians.
Beyond gains from economic growth, another 255,300 job openings will be created on average each year through 2029 to replace workers who retire, leave the labor force for other reasons, or make a major occupational change. Together, the number of job openings due to economic growth and replacements will total an annual average of 273,500.
All private sectors in Oregon are expected to add jobs by 2029. Private health care and social assistance will lead all industries in new job growth. The gain of 46,300 new jobs (15% growth) in health care can be attributed to continued growth and aging of the state’s population. Healthcare will account for one out of every five new jobs created in Oregon by 2029.
Health care also tops the list of Oregon’s fastest-growing occupations over the 10-year period. Healthcare occupations and those associated with healthcare, including mental health, account for 13 of the 20 fastest-growing occupations from 2019 to 2029 among occupations with at least 1,000 jobs in Oregon. Oregon’s second fastest-growing industry will be professional and business services (13% growth).
A broad variety of career opportunities will be available across all sectors as well as all job types. One-third of all job openings will require education or training beyond high school at the typical entry-level education. To meet more competitive education requirements, nearly half of all job openings require at least some training beyond high school.
All areas of Oregon expect to see job opportunities due to both economic growth and to replace workers leaving the labor force in the coming years. The two regions projected to grow at the fastest rates are Central Oregon (12%) and the Portland area (11%).
Additional Information The Oregon Employment Department’s 2019-2029 employment projections are long-term projections intended to capture structural change in the economy, not cyclical fluctuations. As such, they are not intended to project the full impacts of the COVID-19 recession and its recovery.
Oregon’s total nonfarm payroll employment rose by 20,500 jobs in July, following a gain of 57,000 jobs in June. Over the past three months, employers added back 38 percent of the jobs that were cut in March and April.
Over-the-month job gains in July were largest in leisure and hospitality (+7,300 jobs); government (+5,700); retail trade (+3,600); health care and social assistance (+3,100); and professional and business services (+1,900). Meanwhile, three of the major industries cut a substantial number of jobs in July: construction (-1,900 jobs); manufacturing (-1,500); and information (-1,200).
Over the past five months the major industries were impacted differently by the pandemic. Leisure and hospitality suffered by far the largest job loss during March and April, shedding 118,700 jobs during the outset of the pandemic-induced drop in business. Then, between April and July, the industry regained half of the loss, as it rebounded by 58,900 jobs over the past three months. Three industries regained more than half of their lost jobs. Health care and social assistance regained two-thirds of its lost jobs, with a rebound of 18,700 jobs over the past three months. During that time, two industries regained nearly two-thirds of their lost jobs: other services (+9,300 jobs, or a 63% rebound) and retail trade (+13,900 jobs, or 62%).
However, several key industries experienced substantial job losses in March and April but have not rebounded substantially or have even declined further over the past three months. The following industries shed jobs between April and July: government (-5,200 jobs); manufacturing (-3,100); and information (-1,900). Most of the other major industries have regained fewer than 5,000 jobs each over the past three months while regaining less than a third of jobs lost during March and April. These industries include construction; financial activities; private education; professional and business services; and transportation, warehousing, and utilities.
Oregon’s unemployment rate dropped to 10.4 percent in July from 11.6 percent, as revised, in June. In July, Oregon’s unemployment rate was very close to the U.S. unemployment rate; the U.S. rate dropped to 10.2 percent in July from 11.1 percent in June.
Oregon’s total nonfarm payroll employment rose by 56,600 jobs in June, following a gain of 26,100 jobs in May. Over the past two months, employers added back nearly one-third of the jobs that were cut in March and April.
Over-the-month job gains in June were largest in leisure and hospitality (+31,400 jobs); retail trade (+6,800); health care and social assistance (+6,200); and other services (+5,700). None of the major industries cut a substantial number of jobs in June.
Several major industries have regained around half the jobs they lost in March and April. Leisure and hospitality added a total of 47,600 jobs in May and June, which was 39 percent of the 121,500 jobs the industry cut during March and April. Health care and social assistance added 15,700 jobs in May and June, recovering 59 percent of the 26,800 jobs it lost the prior two months. Similarly, retail trade bounced back by 11,500 jobs, or 49 percent, in the past two months, from the 23,300 jobs it shed in March and April.
However, many of the larger industries haven’t seen a substantial rebound in the past two months, including professional and business services, which cut 20,200 jobs in March and April, but has only regained 1,900 jobs during May and June. Fairing even worse were the several industries that have shown no net jobs recovery over the past two months. Manufacturing employed 181,000 in June, which was 2,400 jobs below its April total. Also in the past two months, government cut 9,100 jobs between April and June, during which time management of companies and enterprises cut 1,000 jobs and information cut 600 jobs.
Oregon’s unemployment rate dropped to 11.2 percent in June from 14.3 percent, as revised, in May. In June, Oregon’s unemployment rate was very close to the U.S. unemployment rate; the U.S. rate dropped to 11.1 percent in June from 13.3 percent in May.
The Oregon Employment Department Research section released its latest report, Turning Point 2020: Oregon's Workforce from Expansion to Pandemic in June 2020. The report examines Oregon's employment landscape from the end of the state's longest economic expansion to the beginning of COVID-19 related record job losses. Here is an executive summary:
• Oregon’s unemployment rate rose from a near-record-low 3.5 percent, as revised, in March to a record-high 14.2 percent in April, as COVID-19 business closures shut down a large portion of the economy.
• Oregon’s payroll employers shed nearly 270,000 jobs during March and April. One out of every eight jobs in Oregon was idled or lost in just two months.
• From March 15 through May 16, 2020, the Oregon Employment Department received about 412,000 initial claims for traditional Unemployment Insurance. Job losses were concentrated among younger, lower-wage workers with high school educations or less.
• Oregon’s economy faces many of the same demographic challenges seen across the nation, such as the aging of the workforce and baby boomer retirements, fewer young people participating in the labor force, and slower job growth in rural areas.
• The number of unemployed Oregonians was at a record low in early 2020 – still, amidst the lowest unemployment rates on record in Oregon, one out of five unemployed Oregonians had been unemployed for six months or longer.
• Today, nearly one out of four Oregon workers is age 55 or older, adding up to nearly 439,000 workers in 2018. Of those workers 124,000 were age 65 years and older and working past the traditional age of retirement.
• Oregon’s rural areas tend to have an older population and workforce. Many of these workers are planning to retire in the next 10 years, taking their skills and experience with them. This will adversely impact employers unless they can recruit skilled workers from other areas to sustain the size of their current workforce and fuel their local economies.
• By 2019 the number of jobs in rural Oregon had barely budged above the levels seen back in 2001; rural Oregon gained just 16,000 jobs, adding 7 percent. The Portland-Vancouver-Hillsboro metro outpaced the rest of the state, with a 25 percent gain between 2001 and 2019, amounting to an additional 247,000 jobs. All other metro areas combined gained 23 percent, adding 117,000 jobs.
To learn more about this turning point in our economy, read the full report here.
COVID-19 Impact March data from Oregon’s establishment and household surveys do not reflect the early effects of the coronavirus (COVID-19) pandemic on the labor market. This is because the data used for today’s report was collected prior to public health measures related to social distancing began on March 17th. We expect the April data, published on May 27th, to show the early effects on employment and the unemployment rate in Oregon. Please see the Weekly New Unemployment Insurance Claims report for the latest information on initial claims for unemployment insurance.
March Employment and Unemployment In March, Benton County had Oregon’s lowest seasonally adjusted unemployment rate at 2.6 percent. Other counties with some of the lowest unemployment rates in March include Washington County (2.8%), Hood River (2.8%), and Multnomah (3.0%). Twenty-nine counties had unemployment rates below the national rate of 4.4 percent. Six counties also had unemployment rates at or below the statewide rate of 3.3 percent.
Grant and Klamath counties registered the highest unemployment rates for the month at 6.0 percent. Other counties with some of the highest unemployment rates in March were Wallowa (5.1%) and Crook (4.9%).
In March 2020, all but one of Oregon’s counties were at or below their unemployment rates for March 2019. Sherman County’s unemployment rate increased 0.2 percentage point from March 2019 to 4.1 percent. Lake County’s unemployment rate decreased the most, dropping 2.3 percentage points from 6.5 percent in March 2019 to 4.2 percent in March 2020.
Total nonfarm payroll employment rose in five of Oregon’s broad regions between March 2019 and March 2020. The largest job gains occurred in the Willamette Valley (+1.7%). Central Oregon (+1.4%) and the Portland region (+0.9%) also experienced some of the largest over-the-year employment gains.
The Oregon Employment Department is releasing employment and labor force data for the month of February today. These numbers will not capture any of the economic impacts of COVID-19. Our employment and labor force data will capture current COVID-19 events in the April data to be released in May. The most current labor force data we are able to publish are initial claims for unemployment data.
Record Initial Unemployment Insurance Claims in Oregon During the week of March 15-21, 2020, the Oregon Employment Department processed around 22,800 Unemployment Insurance claims, four times more than the 4,900 processed the week prior. The department received a total of 76,500 claims online and by phone, around 20 times the workload experienced in a typical week. The Employment Department is rapidly redeploying its staff, opening additional phone lines, and hiring new staff in an attempt to address this unprecedented surge in claims. The department is still offering job seeker and employer services with additional, socially distanced options. We are present to help Oregonians who have experienced tremendous disruptions, while also doing our part to follow health and safety guidelines for our communities.
February Employment and Unemployment
In February, Benton County had Oregon’s lowest seasonally adjusted unemployment rate at 2.7 percent. Other counties with some of the lowest unemployment rates in February include Washington (2.9%), Hood River (2.9%), and Multnomah (3.0%). Eight counties had unemployment rates below the national rate of 3.5 percent. Six counties also had unemployment rates at or below the statewide rate of 3.3 percent. Grant and Klamath counties registered the highest unemployment rates for the month at 6.1 percent. Other counties with some of the highest unemployment rates in February were Wallowa (5.3%) and Crook (5.0%).
In February 2020, all but one of Oregon’s
counties were at or below their
unemployment rates for February 2019.
Sherman County’s unemployment rate
increased 0.2 percentage point from
February 2019 to 4.1 percent. Harney
County’s unemployment rate decreased
the most, dropping 2.1 percentage points
from 6.6 percent in February 2019 to 4.5
percent in February 2020.
Total nonfarm payroll employment rose
in six of Oregon’s broad regions between
February 2019 and February 2020. The
largest job gains occurred in the
Willamette Valley (+1.7%). The Portland
region (+1.3%) and Central Oregon
(+1.0%) also experienced some of the
largest over-the-year employment gains.
Next News Releases
The Oregon Employment Department will release statewide unemployment rate and industry
employment data for March 2020 on Tuesday, April 14, 2020. The March 2020 county and
metropolitan area unemployment rates will be released on Tuesday, April 21, 2020.
Oregon’s unemployment rate was 3.3 percent in both January and February, the lowest on comparable records dating back to 1976. The U.S. unemployment rate was 3.5 percent in February.
“It’s too early to have data showing the employment impact, but the response to COVID-19 is causing a reduction in economic activity both nationally and in Oregon. It will be weeks before we can accurately quantify the extent of the damage to Oregon’s labor market,” said Nick Beleiciks, Systems and Economic Analysis manager at the Oregon Employment Department.
Oregon’s labor force data for February shows little impact from the spread of the coronavirus since the February unemployment rate is based on people’s activity during the week that included February 12th. The monthly unemployment rate is always based on a person’s employment status for the week that includes the 12th of each month. By mid-February, there had been relatively limited economic impact from the disease in the U.S. In February, there were 69,000 unemployed Oregonians, which was the lowest number in more than 40 years.
Total nonfarm payroll employment rose by 3,100 jobs in February, following a loss of 300 jobs in January. Two major industries added more than 1,000 jobs in February: construction (+1,700 jobs) and professional and business services (+1,300). Only one industry cut jobs substantially: manufacturing (-500).
Oregon’s nonfarm payroll employment increased by 26,600 jobs, or 1.4 percent, over the year since February 2019. In the past 12 months, transportation, warehousing, and utilities grew at the fastest rate of the major industries, expanding by 3,100 jobs, or 4.5 percent. Information also expanded rapidly, adding 1,100 jobs, or 3.2 percent, since February 2019. Construction (+3,000 jobs, or 2.8%) and other services (+1,900 jobs, or 2.9%) also were leading industries of growth over the past 12 months. Meanwhile, only one industry shed a substantial number of jobs since February 2019; manufacturing dropped 3,700 jobs, declining 1.9 percent.
Benton County had Oregon’s lowest seasonally adjusted unemployment rate at 2.8 percent in January 2020. Other counties with some of the lowest unemployment rates in January include Washington (2.9%), Hood River (3.0%), and Multnomah (3.1%). Six counties had unemployment rates below the national rate of 3.6 percent. The same six counties also had unemployment rates at or below the statewide rate of 3.3 percent.
Grant County registered the highest unemployment rate for the month at 6.3 percent. Other counties with some of the highest unemployment rates in January were Klamath (6.2%) and Wallowa (5.5%).
In January 2020, all of Oregon’s counties were at or below their unemployment rates for January 2019. Sherman County had the same unemployment rate in January 2020 as in January 2019 (4.0%). Harney County’s unemployment rate decreased the most, dropping 1.9 percentage points from 6.6 percent in January 2019 to 4.7 percent in January 2020.
Total nonfarm payroll employment rose in four of Oregon’s six broad regions between January 2019 and January 2020. The largest job gains occurred in the Portland area (+1.1%). The Willamette Valley (+0.9%), Central Oregon (+0.7%), and Southern Oregon (+0.2%) saw employment growth over the past year.