Pages

Showing posts with label Willamette Valley. Show all posts

Tuesday, March 10, 2020

January Employment and Unemployment in Oregon’s Counties

Benton County had Oregon’s lowest seasonally adjusted unemployment rate at 2.8 percent in January 2020. Other counties with some of the lowest unemployment rates in January include Washington (2.9%), Hood River (3.0%), and Multnomah (3.1%). Six counties had unemployment rates below the national rate of 3.6 percent. The same six counties also had unemployment rates at or below the statewide rate of 3.3 percent.

Grant County registered the highest unemployment rate for the month at 6.3 percent. Other counties with some of the highest unemployment rates in January were Klamath (6.2%) and Wallowa (5.5%).

In January 2020, all of Oregon’s counties were at or below their unemployment rates for January 2019. Sherman County had the same unemployment rate in January 2020 as in January 2019 (4.0%). Harney County’s unemployment rate decreased the most, dropping 1.9 percentage points from 6.6 percent in January 2019 to 4.7 percent in January 2020.

Total nonfarm payroll employment rose in four of Oregon’s six broad regions between January 2019 and January 2020. The largest job gains occurred in the Portland area (+1.1%). The Willamette Valley (+0.9%), Central Oregon (+0.7%), and Southern Oregon (+0.2%) saw employment growth over the past year.

Read the full press release here.

Tuesday, December 24, 2019

November 2019 Employment and Unemployment in Oregon’s Counties

Benton County had Oregon’s lowest seasonally adjusted unemployment rate at 3.1 percent in November 2019. Other counties with some of the lowest unemployment rates in November included Washington (3.2%), Hood River (3.3%), and Multnomah (3.4%). These four counties had unemployment rates below the national rate of 3.5 percent. Nine of Oregon’s counties had unemployment rates at or below the statewide rate of 3.9 percent.
Total nonfarm payroll employment rose in all six of Oregon’s broad regions between November 2018 and November 2019. The largest job gains occurred in Central Oregon (+2.5%). Southern Oregon (+1.7%), the Portland area (+1.0%), the Coast (+0.7%), Eastern Oregon (+0.6%), and the Willamette Valley (+0.6%) saw employment growth over the past year.

Read the full press release here

Tuesday, October 22, 2019

September 2019 Employment and Unemployment in Oregon’s Counties

Benton County had Oregon’s lowest seasonally adjusted unemployment rate at 3.3 percent in September 2019. Other counties with some of the lowest unemployment rates in September included Hood River (3.4%), Washington (3.4%), and Multnomah (3.6%). Three counties had unemployment rates at or below the national rate of 3.5 percent. Nine of Oregon’s counties had unemployment rates below the statewide rate of 4.1 percent. Grant County registered the highest unemployment rate for the month at 7.1 percent. Other counties with some of the highest unemployment rates in September were Klamath (6.7%) and Wallowa (6.6%).
Total nonfarm payroll employment rose in all six of Oregon’s broad regions between September 2018 and September 2019. The largest job gains occurred in the Portland area (+1.1%). The Coast (+0.8%), Southern Oregon (+0.8%), the Willamette Valley (+0.7%), Central Oregon (+0. 6%), and Eastern Oregon (+0.4%) also saw employment growth over the past year.
Read the full press release here

Tuesday, September 24, 2019

August 2019 Employment and Unemployment in Oregon’s Counties

Benton County had Oregon’s lowest seasonally adjusted unemployment rate at 3.2 percent in August 2019. Other counties with some of the lowest unemployment rates in August included Hood River (3.4%), Washington (3.4%), and Multnomah (3.5%). Six counties had unemployment rates at or below the national rate of 3.7 percent. Nine of Oregon’s counties had unemployment rates below the statewide rate of 4.0 percent. Grant County registered the highest unemployment rate for the month at 7.1 percent. Other counties with some of the highest unemployment rates in August were Wallowa and Klamath (6.5%).
August 2019 unemployment rates for almost all of Oregon’s counties were similar to what they were in August 2018. Only Wheeler County had a change greater than 1 percentage point, with an increase of 1.2 percentage points in its unemployment rate over the past year. Curry County’s unemployment rate decreased 0.3 percentage point over the past year, the most of any county.

Total nonfarm payroll employment rose in all six of Oregon’s broad regions between August 2018 and August 2019. The largest job gains occurred in the Portland area and Southern Oregon (+1.2%). The Willamette Valley (+0.9%), the Coast (+0.8%), Central Oregon (+0.3%), and Eastern Oregon (+0.3%) also saw employment growth over the past year.
The press release can be found here

Tuesday, August 20, 2019

July 2019 Employment and Unemployment in Oregon’s Counties

Benton County had Oregon’s lowest seasonally adjusted unemployment rate at 3.1 percent in July 2019. Other counties with some of the lowest unemployment rates in June included Washington (3.3%), Hood River (3.4%), and Multnomah (3.5%). Seven counties had unemployment rates at or below the national rate of 3.7 percent. Eight of Oregon’s counties had unemployment rates below the statewide rate of 4.0 percent. 

Grant County registered the highest unemployment rate for the month at 7.3 percent. Other counties with some of the highest unemployment rates in July were Wallowa and Klamath (6.4%). July 2019 unemployment rates for almost all of Oregon’s counties were similar to what they were in July 2018. 
Total nonfarm payroll employment rose in all six of Oregon’s broad regions between July 2018 and July 2019. The largest job gains occurred in the Portland area (+1.5%). Southern Oregon (+1.1%), the Willamette Valley (0.9%), the Coast (+0.8%), Eastern Oregon (+0.8%), and Central Oregon (+0.4%) also saw employment growth over the past year.

Read the full press release here

Tuesday, July 23, 2019

June 2019 Employment and Unemployment in Oregon’s Counties

Benton County had Oregon’s lowest seasonally adjusted unemployment rate at 3.2 percent in June 2019. Other counties with some of the lowest unemployment rates in June included Washington (3.3%), Hood River (3.5%), and Multnomah (3.5%). Seven counties had unemployment rates at or below the national rate of 3.7 percent. Eight of Oregon’s counties had unemployment rates below the statewide rate of 4.1 percent.

Grant County registered the highest unemployment rate for the month at 7.5 percent. Other counties with some of the highest unemployment rates in June were Klamath (6.5%) and Wallowa (6.3%).
Read the full press release here.

Tuesday, June 25, 2019

May 2019 Employment and Unemployment in Oregon’s Counties

Benton County had Oregon’s lowest seasonally adjusted unemployment rate at 3.2 percent in May 2019. Other counties with some of the lowest unemployment rates in May included Washington (3.4%) and Hood River (3.5%). Only Benton, Washington, Hood River, and Multnomah counties had unemployment rates at or below the national rate of 3.6 percent. Eight of Oregon’s counties had unemployment rates below the statewide rate of 4.2 percent.

Grant County registered the highest unemployment rate for the month at 7.8 percent. Other counties with some of the highest unemployment rates in May were Klamath (6.7%); and Wallowa, Lake, and Harney (6.3%). May 2019 unemployment rates for almost all of Oregon’s counties were similar to what they were in May 2018. Only Wheeler (+1.5%), Grant (+1.1%), and Gilliam (+1.0%) counties had unemployment rates change more than 1 percentage point over the past year.
Read the full press release here

Tuesday, May 21, 2019

April 2019 Employment and Unemployment in Oregon’s Counties

Benton County had Oregon’s lowest seasonally adjusted unemployment rate at 3.3 percent in April 2019. Other counties with some of the lowest unemployment rates in April included Washington (3.5%) and Hood River (3.6%). Only Benton, Washington, and Hood River counties had unemployment rates at or below the national rate of 3.6 percent. Eight of Oregon’s counties had unemployment rates below the statewide rate of 4.3 percent. 

Grant County registered the highest unemployment rate for the month at 8.0 percent. Other counties with some of the highest unemployment rates in April were Klamath (6.9%) and Harney (6.6%). April 2019 unemployment rates for almost all of Oregon’s counties were similar to what they were in April 2018. Only Wheeler (+1.5%), Gilliam (+1.1%), Grant (+1.1%), and Lake (+1.1%) counties had unemployment rates change more than 1 percentage point over the past year.
Read the full press release here

Tuesday, April 23, 2019

March 2019 Employment and Unemployment in Oregon’s Counties

Benton County had Oregon’s lowest seasonally adjusted unemployment rate at 3.4 percent in March 2019. Other counties with some of the lowest unemployment rates in March included Washington (3.6%), Clackamas, Hood River, Multnomah, and Yamhill (all at 3.9%). Only Benton and Washington counties had unemployment rates at or below the national rate of 3.8 percent. Seven of Oregon’s counties had unemployment rates below the statewide rate of 4.4 percent.

Grant County registered the highest unemployment rate for the month at 8.4 percent. Other counties with some of the highest unemployment rates in March were Klamath (7.3%) and Harney (6.9%). The March 2019 unemployment rates of almost all of Oregon’s counties were higher than they were in March 2018.
Read the full press release here

Tuesday, March 26, 2019

February 2019 Employment and Unemployment in Oregon’s Counties

Benton County had Oregon’s lowest seasonally adjusted unemployment rate at 3.4 percent in February 2019. Other counties with some of the lowest unemployment rates in February included Washington (3.7%) and Hood River (3.8%). Only these three counties had unemployment rates at or below the national rate of 3.8 percent. Seven of Oregon’s counties had unemployment rates below the statewide rate of 4.4 percent. 

Grant County registered the highest unemployment rate for the month at 8.7 percent. Other counties with some of the highest unemployment rates in February were Klamath (7.4%) and Harney (7.1%).

The February 2019 unemployment rates of all of Oregon’s counties were higher than they were in February 2018. The largest changes from the previous year were in Wheeler (+1.8%), Grant (+1.7%), and Gilliam (+1.6%).

Read the full press release here

Tuesday, March 12, 2019

January 2019 Employment and Unemployment in Oregon’s Counties

Benton County had Oregon’s lowest seasonally adjusted unemployment rate at 3.4 percent in January 2019. Other counties with some of the lowest unemployment rates in January included Hood River (3.5%) and Washington (3.7%). Seven of Oregon’s counties had unemployment rates at or below the statewide unemployment rate of 4.3 percent and the national rate of 4.0 percent.

Grant County registered the highest unemployment rate for the month at 8.5 percent. Other counties with some of the highest unemployment rates in January were Harney and Klamath (7.2%).

Total nonfarm payroll employment rose in all six of Oregon’s broad regions between January 2018 and January 2019. The largest job gains occurred in Southern Oregon and Central Oregon (+1.5%). The Portland Area (+1.2%), the Coast (+0.8%), the Willamette Valley (+0.6%) and Eastern Oregon (+0.6%) also added jobs.

Read the full press release here

Wednesday, January 23, 2019

December 2018 Employment and Unemployment in Oregon’s Counties

Benton County had Oregon’s lowest seasonally adjusted unemployment rate at 3.3 percent in December 2018. Other counties with some of the lowest unemployment rates in December included Hood River (3.5%), Washington (3.5%), and Multnomah (3.7%).

Seven of Oregon’s counties had unemployment rates at or below the statewide unemployment rate of 4.1 percent and six were at or below the national rate of 3.9 percent. Eastern and Southern Oregon had higher unemployment rates in December 2018, which were still close to their record low unemployment rates since 1990.

Grant County registered the highest unemployment rate for the month at 7.4 percent. Other counties with some of the highest unemployment rates in December were Klamath (6.6%) and Curry (6.5%).

Read the full press release here

Thursday, January 17, 2019

Employer-Provided Benefits in Oregon

Three-fourths (76%) of Oregon's private employers offered one or more health, retirement, leave, pay, or other benefits to employees in June 2018. More than half (59%) of all employers offered health benefits, while 51 percent offered retirement benefits. This findings come from a survey of more than 12,000 private employers conducted by the Employment Department, and summarized in the new report Employer-Provided Benefits: Offerings, Enrollment, and Rising Costs.

A few big themes emerged from the survey. First, larger shares of private employers offered benefits to full-time employees than part-time employees. This was true across the board. While about six out of 10 employers offered health benefits to full-time employees, just one out of 10 extended the offering to part-time employees. Half of all private employers offered retirement benefits to full-time employees, while 23 percent offered them to part-time employees.

Second, as a firm's size class increased, so did the likelihood of offering benefits. The most common benefit offerings in June 2018 included health benefits, retirement benefits, paid holidays, paid vacation, unpaid leave, and annual pay raises. The share of mid-sized employers (10 to 49 payroll employees in Oregon) generally reflected the overall trend for benefit offerings. Shares of the smallest employers (2 to 9 employees) and largest employers (50+ employees) offering these benefits showed great disparity though. The biggest differences occurred in overall health and retirement offerings, where the share of the largest employers extending benefits exceeded the smallest employers by more than 50 percentage points.

Another notable trend Oregon employers detailed was the high cost of providing health benefits. When employers with health benefits were asked to describe the most important effects on their business and workforce over the past year, two-thirds (67%) mentioned the high/higher/increasing costs of health care. In addition, almost three-fourths (73%) of employers with health benefit offerings noted that the total cost of their plan increased over the past year.

More information about employer-provided benefits, both regionally and statewide, can be found at QualityInfo.org/benefits. Check out our interactive graphs and benefits podcast too!


Thursday, December 27, 2018

November 2018 Employment and Unemployment in Oregon’s Counties

Benton County had Oregon’s lowest seasonally adjusted unemployment rate at 3.3 percent in November 2018. Other counties with some of the lowest unemployment rates in November included Hood River (3.4%), Washington (3.4%), and Multnomah (3.6%). 

Seven of Oregon’s counties had unemployment rates at or below the statewide unemployment rate of 3.9 percent and four were at or below the national rate of 3.7 percent. Eastern and Southern Oregon had higher unemployment rates in November 2018, which were still close to their record low unemployment rates since 1990. 
Grant County registered the highest unemployment rate for the month at 7.1 percent, which was 1 percentage higher than Grant’s lowest unemployment rate since comparable records began in 1990. Harney County’s unemployment rate improved over the year by 0.7 percentage point, more than any other county.

Total nonfarm payroll employment rose in all six of Oregon’s broad regions between November 2017 and November 2018. The largest job gains occurred in Central Oregon (+2.3%). The Willamette Valley (+1.9%), Southern Oregon (+1.4%), the Portland area (+1.3%), the Oregon Coast (+0.8%), and Eastern Oregon (+0.7%) also added jobs.

Press releases for all Oregon areas are available here. 

Wednesday, June 27, 2018

Why is it Difficult to Fill Job Vacancies in Oregon?

Each year we summarize the key findings from our job vacancy survey into a report, with specific emphasis on the challenges businesses face filling their job vacancies. In 2017, Oregon businesses reported 60,700 job vacancies at any given time in 2017. Of these vacancies, 38,700 job openings (64%) were reported as difficult to fill.

For each of their difficult-to-fill vacancies, employers offered open-ended responses to identify what they thought was the primary reason for the unfilled opening. A lack of applicants was the most common challenge filling vacancies. Nearly one out of every three (30%) difficult-to-fill job vacancies had an insufficient number of applicants or no applicants at all. That makes sense, given the state's continued job growth and historic low unemployment rate. The point was made clear by the construction business that was having difficulty hiring heating, air conditioning, and refrigeration mechanics and installers because, “The heating industry is busy and anyone who has experience is already working elsewhere.”

A lack of qualified candidates was the second most common reason given by businesses for their difficulty filling vacancies. It was the primary reason given for 6,100 vacancies and represented 17 percent of all difficult-to-fill vacancies. Some referenced very specific qualifications or specialized knowledge within a particular occupation and specific setting, such as the bank with a difficult-to-fill loan officer vacancy that mentioned, “Mortgage underwriting with government loan experience is rare and in high demand.” 

Unfavorable working conditions was the main reason businesses reported difficulty filling nearly 5,000 vacancies, and represented 14 percent of all hard-to-fill vacancies. These vacancies were for jobs that employers candidly reported were not the best working conditions for most people because they had inconsistent shifts, part-time only shifts, or were physically demanding jobs. Examples included vacancies at a Mid-Valley farm where the job was physically demanding and the workers “must be comfortable working with chickens, around manure, etc.” 

Businesses said the lack of soft skills among applicants was the primary reason for difficulty filling nearly 4,000 vacancies, which was 11 percent of all difficult-to-fill vacancies. Soft skills include professional competencies required for a job, such as communication, interpersonal, and social skills. In the Job Vacancy Survey it included employer responses related to subjective traits such as honesty, reliability, and motivation. It also included more quantifiable traits such as having a valid driver’s license and clean driving record, passing a background check, and passing a drug screen.

A lack of previous work experience was given by business as the primary cause that 3,200 vacancies were difficult to fill, which totaled 9 percent of all difficult-to-fill vacancies. Most businesses value applicants with previous work experience and it is a big contributor in making vacancies difficult to fill. There are far fewer experienced workers looking for jobs now than a few years ago when the unemployment rate was much higher, and this is making it difficult to fill vacancies across a wide variety of occupations.

Occupations with the largest number of vacancies that, according to businesses, were difficult-to-fill because of low wages, tended to (understandably) be low-wage occupations. Personal care aides topped the list with 392 vacancies that were difficult to fill due to low wages. 

You can find more information about Oregon's difficult-to-fill job vacancies in the full report on Oregon's Current Workforce Gaps, written by State Employment Economist Nick Beleiciks.

Tuesday, May 22, 2018

April 2018 Employment and Unemployment in Oregon’s Counties

Wheeler County had Oregon’s lowest seasonally adjusted unemployment rate at 3.0 percent in April 2018. Other counties with some of the lowest unemployment rates in April included Benton (3.1%), Gilliam (3.2%), and Hood River (3.2%). Grant County registered the highest unemployment rate for the month at 7.2 percent.

Twelve of Oregon’s counties had unemployment rates at or below the statewide unemployment rate of 4.1 percent. Wheeler County saw its unemployment rate improve over the year by 1.4 percentage points, more than any other county. Klamath County saw its unemployment rate increase the most of any county over the past year, rising 0.5 percentage point to 6.3 percent. 

Total nonfarm payroll employment rose in five of Oregon’s six broad regions between April 2017 and April 2018. The largest job gains occurred in Central Oregon (+2.9%). Southern Oregon (+2.7%), the Willamette Valley (+2.1%), the Portland area (+1.3%), and the Oregon Coast (+1.2%) also added jobs. Eastern Oregon had no growth over the past year.

To learn more about the employment situation for your county, click here. To see the full press release, click here.

Tuesday, April 24, 2018

March 2018 Employment and Unemployment in Oregon’s Counties

Wheeler County had Oregon’s lowest seasonally adjusted unemployment rate at 2.9 percent in March 2018. Other counties with some of the lowest unemployment rates in March included Benton (3.1%) and Hood River (3.2%). 

Eastern and Southern Oregon had higher unemployment rates in March 2018, which were still close to their record low unemployment rates since 1990. Grant County registered the highest unemployment rate for the month at 7.3 percent.

Ten of Oregon’s counties had unemployment rates at or below the statewide and national unemployment rate of 4.1 percent. Wheeler County saw its unemployment rate improve over the year by 1.4 percentage points, more than any other county. Josephine County saw its unemployment rate increase the most of any county over the past year, rising 0.8 percentage point to 5.3 percent.

To learn more about the employment situation for your county, click here. To see the full press release, click here.

Tuesday, March 27, 2018

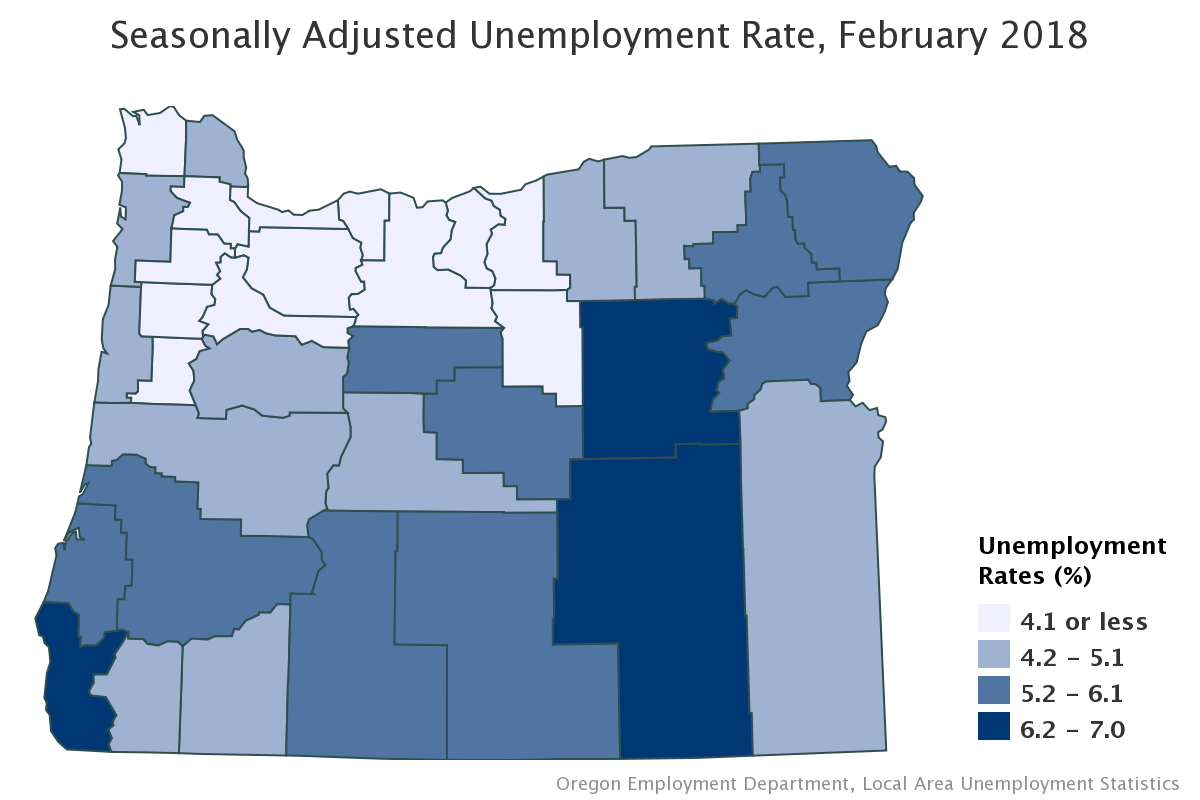
February 2018 Employment and Unemployment in Oregon’s Counties

Wheeler County had Oregon’s lowest seasonally adjusted unemployment rate at 2.8 percent in February 2018. Other counties with some of the lowest unemployment rates in February include Gilliam (2.9%) and Benton (3.1%). Grant County registered the highest unemployment rate for the month at 7.0 percent.

Thirteen of Oregon’s counties had unemployment rates at or below the statewide and national unemployment rate of 4.1 percent. Wheeler County saw its unemployment rate improve over the year by 1.6 percentage points, more than any other county. Deschutes County saw its unemployment rate increase the most of any county over the past year, 0.6 percentage point.

Total nonfarm payroll employment rose in all of Oregon’s six broad regions between February 2017 and February 2018. The largest job gains occurred in Central Oregon (+3.1%). Southern Oregon (+2.5%), the Willamette Valley (+1.8%), the Portland area (+1.6%), and Eastern Oregon (+1.1%) also saw growth. The Oregon Coast saw a slight job gain of 0.2 percent.
To learn more about the employment situation for your county, click here. To see the full press release, click here.

Tuesday, March 13, 2018

January 2018 Employment and Unemployment in Oregon’s Counties

Benton County had Oregon’s lowest seasonally adjusted unemployment rate at 2.9 percent in January 2018. Other counties with some of the lowest unemployment rates in January include Wheeler (3.0%) and Hood River (3.2%).

Eastern and Southern Oregon had higher unemployment rates in January 2018, some of which were still at or close to their record low unemployment rates since 1990. Grant County registered the highest unemployment rate for the month at 6.7 percent.

Sixteen of Oregon’s counties had unemployment rates at or below the statewide and national unemployment rate of 4.1 percent. Harney County saw its unemployment rate increase over the year by 0.5 percentage point. All other counties in the state saw improvements in the unemployment rate over the past year. Wheeler County improved 1.4 percentage points, more than any other county.
To learn more about the employment situation for your county, click here. To see the full press release, click here.

Tuesday, January 30, 2018

Per Capita Personal Income in Oregon

In 2016, Oregon had a per capita personal income (PCPI) of $45,399. Oregon’s PCPI ranked 29th in the United States and was 92 percent of the national average, $49,246, according to the U.S. Bureau of Economic Analysis. In Oregon, the 2016 PCPI increased by 2.4 percent from 2015, faster than the nationwide PCPI growth rate of 1.6 percent.

Per capita personal income also varies between states and counties, and by metro and nonmetro areas. A look at county numbers shows high variability in PCPI. In general, PCPI is higher in the Portland and Bend area and along the Columbia Gorge. Sherman County, a nonmetro area, actually had the highest PCPI in 2016 at $55,846.

The three major components of per capita personal income – net earnings; transfer receipts; and dividends, interest, and rent – make up different portions of counties’ PCPI. In general, counties with higher PCPI have a higher percentage of PCPI attributable to net earnings. Per capita net earnings made up 66.3 percent of PCPI in Washington County and 60.4 percent in Multnomah and Clackamas counties. In Malheur County, per capita net earnings made up just 24.6 percent of PCPI.

Areas with a higher concentration of older residents can show lower PCPI. In Oregon, Malheur County ($29,714) and Jefferson County ($32,670) had the lowest PCPI. The reason is that as people leave the labor force, they have likely passed their peak earning years, and therefore have less contribution to the net earnings component of personal income. Remember PCPI represents income, rather than wealth. Older residents may have substantial wealth, but not have as much relative income, unless it was income-generating investments that would show up in the “dividends, interest, and rent” portion of PCPI.

Read the full article "Per Capita Personal Income in Oregon" by Economist Felicia Bechtoldt