Pages

Showing posts with label Coastal Oregon. Show all posts

Friday, September 11, 2020

Wildfires in Oregon: Businesses and Jobs in Evacuation Zones

Over the past several days, we've watched in collective fear and sadness as nearly 1 million acres of our beautiful state have gone up in flames. While in recent history most wildfires have been isolated to wilderness areas, the 16 fires currently burning across Oregon are destroying homes and businesses in several areas across the state. While the Research Division of the Employment Department cannot quantify or capture the immensity of these losses, we do have information about the businesses and jobs in current wildfire evacuation zones.

To get to such detailed levels of geography, we have to use information from our Quarterly Census of Employment and Wages, and that information has a time lag. So the estimates used here reflect business establishments and jobs covered by Unemployment Insurance taxes as of this time last year, the third quarter of 2019.

The number of business establishments in wildfire evacuation zones as of 8:30 a.m. today (September 11) totaled 21,350 across 13 different counties. These business establishments had 232,600 jobs. For context, that's nearly the same size as the entire private health care industry (262,400 jobs) in Oregon statewide during the third quarter of 2019. The majority of these business establishments (60%) and their jobs (61%) are under Level 1 (or "Be Ready") evacuation orders. Another 30 percent of the affected businesses (and 29% of their jobs) are in Level 2 (or "Be Set") evacuation status. 

One out of 10 business establishments and related employment in current wildfire evacuation zones are in Level 3 ("Go") status. 


Clackamas County has both the largest employment in Level 3 areas (10,000 jobs) and across all evacuation levels (166,000). Jackson County's employment in current evacuation zones totals 37,300 jobs, with 4,000 of those in Level 3 areas. While Marion County has the third-highest total of jobs in all evacuation areas (13,100), Lincoln County has the third-highest Level 3 jobs count (2,100). 

By industry sector, those with the largest job totals in all levels of evacuation zones -- health care, retail trade, and leisure and hospitality -- are among the state's largest overall industries. If we look just at the most-impacted, Level 3 areas though, the largest numbers of jobs come from natural resources and mining (3,700), which makes sense given the geography of wildfires. The level of impact is notable though: while natural resources and mining made up 4 percent of all jobs in the third quarter of 2019, the industry accounts for one out of five (18%) of Level 3 evacuation area jobs. Construction is also disproportionately affected, with 13 percent of Level 3 area jobs, compared with 8 percent of all jobs.

We'll continue to update these numbers and publish them as the fire situation continues to develop. In the meantime, take care everyone, and if you have questions, please send them to me at Gail.K.Krumenauer@oregon.gov.


Tuesday, March 10, 2020

January Employment and Unemployment in Oregon’s Counties

Benton County had Oregon’s lowest seasonally adjusted unemployment rate at 2.8 percent in January 2020. Other counties with some of the lowest unemployment rates in January include Washington (2.9%), Hood River (3.0%), and Multnomah (3.1%). Six counties had unemployment rates below the national rate of 3.6 percent. The same six counties also had unemployment rates at or below the statewide rate of 3.3 percent.

Grant County registered the highest unemployment rate for the month at 6.3 percent. Other counties with some of the highest unemployment rates in January were Klamath (6.2%) and Wallowa (5.5%).

In January 2020, all of Oregon’s counties were at or below their unemployment rates for January 2019. Sherman County had the same unemployment rate in January 2020 as in January 2019 (4.0%). Harney County’s unemployment rate decreased the most, dropping 1.9 percentage points from 6.6 percent in January 2019 to 4.7 percent in January 2020.

Total nonfarm payroll employment rose in four of Oregon’s six broad regions between January 2019 and January 2020. The largest job gains occurred in the Portland area (+1.1%). The Willamette Valley (+0.9%), Central Oregon (+0.7%), and Southern Oregon (+0.2%) saw employment growth over the past year.

Read the full press release here.

Tuesday, January 28, 2020

December 2019 Employment and Unemployment in Oregon’s Counties

Benton and Washington County had Oregon’s lowest seasonally adjusted unemployment rates at 3.0 percent in December 2019. Other counties with some of the lowest unemployment rates in December included Hood River (3.1%) and Multnomah (3.2%). Seven counties had unemployment rates below the national rate of 3.5 percent. Nine of Oregon’s counties had unemployment rates at or below the statewide rate of 3.7 percent.

Grant County registered the highest unemployment rate for the month at 6.6 percent. Other counties with some of the highest unemployment rates in November were Klamath (6.3%) and Wallowa (5.9%).

In December 2019, all of Oregon’s counties were at or below their unemployment rates for December 2018. Wheeler County had the same unemployment rate in December 2018 as in December 2019 (4.5%). Curry County’s unemployment decreased the most, from 6.8 percent in December 2018 to 5.1 percent in December 2019.


Total nonfarm payroll employment rose in all six of Oregon’s broad regions between December 2018 and December 2019. The largest job gains occurred in Central Oregon (+2.2%). The Portland area (+1.0%), Southern Oregon (+1.0%), the Willamette Valley (+0.8%), the Coast (+0.7%), and Eastern Oregon (+0.6%) also saw employment growth over the past year.

Read the full press release here.

Tuesday, December 24, 2019

November 2019 Employment and Unemployment in Oregon’s Counties

Benton County had Oregon’s lowest seasonally adjusted unemployment rate at 3.1 percent in November 2019. Other counties with some of the lowest unemployment rates in November included Washington (3.2%), Hood River (3.3%), and Multnomah (3.4%). These four counties had unemployment rates below the national rate of 3.5 percent. Nine of Oregon’s counties had unemployment rates at or below the statewide rate of 3.9 percent.
Total nonfarm payroll employment rose in all six of Oregon’s broad regions between November 2018 and November 2019. The largest job gains occurred in Central Oregon (+2.5%). Southern Oregon (+1.7%), the Portland area (+1.0%), the Coast (+0.7%), Eastern Oregon (+0.6%), and the Willamette Valley (+0.6%) saw employment growth over the past year.

Read the full press release here

Tuesday, October 22, 2019

September 2019 Employment and Unemployment in Oregon’s Counties

Benton County had Oregon’s lowest seasonally adjusted unemployment rate at 3.3 percent in September 2019. Other counties with some of the lowest unemployment rates in September included Hood River (3.4%), Washington (3.4%), and Multnomah (3.6%). Three counties had unemployment rates at or below the national rate of 3.5 percent. Nine of Oregon’s counties had unemployment rates below the statewide rate of 4.1 percent. Grant County registered the highest unemployment rate for the month at 7.1 percent. Other counties with some of the highest unemployment rates in September were Klamath (6.7%) and Wallowa (6.6%).
Total nonfarm payroll employment rose in all six of Oregon’s broad regions between September 2018 and September 2019. The largest job gains occurred in the Portland area (+1.1%). The Coast (+0.8%), Southern Oregon (+0.8%), the Willamette Valley (+0.7%), Central Oregon (+0. 6%), and Eastern Oregon (+0.4%) also saw employment growth over the past year.
Read the full press release here

Tuesday, September 24, 2019

August 2019 Employment and Unemployment in Oregon’s Counties

Benton County had Oregon’s lowest seasonally adjusted unemployment rate at 3.2 percent in August 2019. Other counties with some of the lowest unemployment rates in August included Hood River (3.4%), Washington (3.4%), and Multnomah (3.5%). Six counties had unemployment rates at or below the national rate of 3.7 percent. Nine of Oregon’s counties had unemployment rates below the statewide rate of 4.0 percent. Grant County registered the highest unemployment rate for the month at 7.1 percent. Other counties with some of the highest unemployment rates in August were Wallowa and Klamath (6.5%).
August 2019 unemployment rates for almost all of Oregon’s counties were similar to what they were in August 2018. Only Wheeler County had a change greater than 1 percentage point, with an increase of 1.2 percentage points in its unemployment rate over the past year. Curry County’s unemployment rate decreased 0.3 percentage point over the past year, the most of any county.

Total nonfarm payroll employment rose in all six of Oregon’s broad regions between August 2018 and August 2019. The largest job gains occurred in the Portland area and Southern Oregon (+1.2%). The Willamette Valley (+0.9%), the Coast (+0.8%), Central Oregon (+0.3%), and Eastern Oregon (+0.3%) also saw employment growth over the past year.
The press release can be found here

Tuesday, August 20, 2019

July 2019 Employment and Unemployment in Oregon’s Counties

Benton County had Oregon’s lowest seasonally adjusted unemployment rate at 3.1 percent in July 2019. Other counties with some of the lowest unemployment rates in June included Washington (3.3%), Hood River (3.4%), and Multnomah (3.5%). Seven counties had unemployment rates at or below the national rate of 3.7 percent. Eight of Oregon’s counties had unemployment rates below the statewide rate of 4.0 percent. 

Grant County registered the highest unemployment rate for the month at 7.3 percent. Other counties with some of the highest unemployment rates in July were Wallowa and Klamath (6.4%). July 2019 unemployment rates for almost all of Oregon’s counties were similar to what they were in July 2018. 
Total nonfarm payroll employment rose in all six of Oregon’s broad regions between July 2018 and July 2019. The largest job gains occurred in the Portland area (+1.5%). Southern Oregon (+1.1%), the Willamette Valley (0.9%), the Coast (+0.8%), Eastern Oregon (+0.8%), and Central Oregon (+0.4%) also saw employment growth over the past year.

Read the full press release here

Tuesday, July 23, 2019

June 2019 Employment and Unemployment in Oregon’s Counties

Benton County had Oregon’s lowest seasonally adjusted unemployment rate at 3.2 percent in June 2019. Other counties with some of the lowest unemployment rates in June included Washington (3.3%), Hood River (3.5%), and Multnomah (3.5%). Seven counties had unemployment rates at or below the national rate of 3.7 percent. Eight of Oregon’s counties had unemployment rates below the statewide rate of 4.1 percent.

Grant County registered the highest unemployment rate for the month at 7.5 percent. Other counties with some of the highest unemployment rates in June were Klamath (6.5%) and Wallowa (6.3%).
Read the full press release here.

Tuesday, June 25, 2019

May 2019 Employment and Unemployment in Oregon’s Counties

Benton County had Oregon’s lowest seasonally adjusted unemployment rate at 3.2 percent in May 2019. Other counties with some of the lowest unemployment rates in May included Washington (3.4%) and Hood River (3.5%). Only Benton, Washington, Hood River, and Multnomah counties had unemployment rates at or below the national rate of 3.6 percent. Eight of Oregon’s counties had unemployment rates below the statewide rate of 4.2 percent.

Grant County registered the highest unemployment rate for the month at 7.8 percent. Other counties with some of the highest unemployment rates in May were Klamath (6.7%); and Wallowa, Lake, and Harney (6.3%). May 2019 unemployment rates for almost all of Oregon’s counties were similar to what they were in May 2018. Only Wheeler (+1.5%), Grant (+1.1%), and Gilliam (+1.0%) counties had unemployment rates change more than 1 percentage point over the past year.
Read the full press release here

Tuesday, May 21, 2019

April 2019 Employment and Unemployment in Oregon’s Counties

Benton County had Oregon’s lowest seasonally adjusted unemployment rate at 3.3 percent in April 2019. Other counties with some of the lowest unemployment rates in April included Washington (3.5%) and Hood River (3.6%). Only Benton, Washington, and Hood River counties had unemployment rates at or below the national rate of 3.6 percent. Eight of Oregon’s counties had unemployment rates below the statewide rate of 4.3 percent. 

Grant County registered the highest unemployment rate for the month at 8.0 percent. Other counties with some of the highest unemployment rates in April were Klamath (6.9%) and Harney (6.6%). April 2019 unemployment rates for almost all of Oregon’s counties were similar to what they were in April 2018. Only Wheeler (+1.5%), Gilliam (+1.1%), Grant (+1.1%), and Lake (+1.1%) counties had unemployment rates change more than 1 percentage point over the past year.
Read the full press release here

Tuesday, April 23, 2019

March 2019 Employment and Unemployment in Oregon’s Counties

Benton County had Oregon’s lowest seasonally adjusted unemployment rate at 3.4 percent in March 2019. Other counties with some of the lowest unemployment rates in March included Washington (3.6%), Clackamas, Hood River, Multnomah, and Yamhill (all at 3.9%). Only Benton and Washington counties had unemployment rates at or below the national rate of 3.8 percent. Seven of Oregon’s counties had unemployment rates below the statewide rate of 4.4 percent.

Grant County registered the highest unemployment rate for the month at 8.4 percent. Other counties with some of the highest unemployment rates in March were Klamath (7.3%) and Harney (6.9%). The March 2019 unemployment rates of almost all of Oregon’s counties were higher than they were in March 2018.
Read the full press release here

Tuesday, March 26, 2019

February 2019 Employment and Unemployment in Oregon’s Counties

Benton County had Oregon’s lowest seasonally adjusted unemployment rate at 3.4 percent in February 2019. Other counties with some of the lowest unemployment rates in February included Washington (3.7%) and Hood River (3.8%). Only these three counties had unemployment rates at or below the national rate of 3.8 percent. Seven of Oregon’s counties had unemployment rates below the statewide rate of 4.4 percent. 

Grant County registered the highest unemployment rate for the month at 8.7 percent. Other counties with some of the highest unemployment rates in February were Klamath (7.4%) and Harney (7.1%).

The February 2019 unemployment rates of all of Oregon’s counties were higher than they were in February 2018. The largest changes from the previous year were in Wheeler (+1.8%), Grant (+1.7%), and Gilliam (+1.6%).

Read the full press release here

Tuesday, March 12, 2019

January 2019 Employment and Unemployment in Oregon’s Counties

Benton County had Oregon’s lowest seasonally adjusted unemployment rate at 3.4 percent in January 2019. Other counties with some of the lowest unemployment rates in January included Hood River (3.5%) and Washington (3.7%). Seven of Oregon’s counties had unemployment rates at or below the statewide unemployment rate of 4.3 percent and the national rate of 4.0 percent.

Grant County registered the highest unemployment rate for the month at 8.5 percent. Other counties with some of the highest unemployment rates in January were Harney and Klamath (7.2%).

Total nonfarm payroll employment rose in all six of Oregon’s broad regions between January 2018 and January 2019. The largest job gains occurred in Southern Oregon and Central Oregon (+1.5%). The Portland Area (+1.2%), the Coast (+0.8%), the Willamette Valley (+0.6%) and Eastern Oregon (+0.6%) also added jobs.

Read the full press release here

Thursday, February 7, 2019

Regional Comparisons of Employer-Provided Benefits in Oregon

Our recently released report about employer-provided benefits in Oregon details the most common health, retirement, leave, pay, and other offerings private employers extended to their full-time and part-time employees in June 2018.

Among the key findings: private companies in Portland and the Willamette Valley tended to have the largest shares of employers offering benefits. In addition, larger shares of firms with at least 50 payroll employees in Oregon offered benefits than the smallest firms (2 to 9 employees).

There's some interplay between these themes. Portland and the Willamette Valley have the largest concentrations of the the largest firms. Industries like leisure and hospitality and natural resources, which tend to have smaller shares of employers offering benefits, also tend to be more concentrated in more tourism-reliant and/or rural areas such as the Oregon Coast and Eastern Oregon. Relatedly, the Oregon Coast and Eastern Oregon are the regions with the smallest shares of employers offering benefits.
Even with these influencing factors, in many cases the top line regional variation in benefit offerings seems relatively small. Looking, for example, at retirement, annual pay raises, unpaid leave, and paid vacation, at most six out of 10 employers extend the option, and at a minimum four out of 10 employers in a region offer them.

Wider differences emerge when we also consider that private employers are far more likely to offer benefits to full-time employees than their part-time counterparts. The most commonly offered single benefit in Oregon in June 2018 was employee medical insurance. More than half (57%) of all private employers offered this to full-time workers, while 10 percent extended the option to part-time workers.
Returning to the Portland vs. Coast comparison, seven out of 10 employers in the state's largest metropolitan area offered employee medical insurance, compared with four out of 10 coastal companies. In Eastern Oregon, one-third of employers offered employee medical to full-timers. Portland employers were three times more likely to offer employee medical insurance to part-time employees than companies on the coast or in Eastern Oregon. Differences like these can also be found in family medical insurance and vision coverage, but the trend isn't universal. Employers in Eastern Oregon and along the coast are more likely to offer SEP or SIMPLE retirement options to full-time and part-time employees than companies in Portland or the Willamette Valley.

More information about employer-provided benefits in Oregon -- including interactive graphs, a podcast, and the full report -- can be found on the benefits page at QualityInfo.org.


Wednesday, January 23, 2019

December 2018 Employment and Unemployment in Oregon’s Counties

Benton County had Oregon’s lowest seasonally adjusted unemployment rate at 3.3 percent in December 2018. Other counties with some of the lowest unemployment rates in December included Hood River (3.5%), Washington (3.5%), and Multnomah (3.7%).

Seven of Oregon’s counties had unemployment rates at or below the statewide unemployment rate of 4.1 percent and six were at or below the national rate of 3.9 percent. Eastern and Southern Oregon had higher unemployment rates in December 2018, which were still close to their record low unemployment rates since 1990.

Grant County registered the highest unemployment rate for the month at 7.4 percent. Other counties with some of the highest unemployment rates in December were Klamath (6.6%) and Curry (6.5%).

Read the full press release here

Thursday, December 27, 2018

November 2018 Employment and Unemployment in Oregon’s Counties

Benton County had Oregon’s lowest seasonally adjusted unemployment rate at 3.3 percent in November 2018. Other counties with some of the lowest unemployment rates in November included Hood River (3.4%), Washington (3.4%), and Multnomah (3.6%). 

Seven of Oregon’s counties had unemployment rates at or below the statewide unemployment rate of 3.9 percent and four were at or below the national rate of 3.7 percent. Eastern and Southern Oregon had higher unemployment rates in November 2018, which were still close to their record low unemployment rates since 1990. 
Grant County registered the highest unemployment rate for the month at 7.1 percent, which was 1 percentage higher than Grant’s lowest unemployment rate since comparable records began in 1990. Harney County’s unemployment rate improved over the year by 0.7 percentage point, more than any other county.

Total nonfarm payroll employment rose in all six of Oregon’s broad regions between November 2017 and November 2018. The largest job gains occurred in Central Oregon (+2.3%). The Willamette Valley (+1.9%), Southern Oregon (+1.4%), the Portland area (+1.3%), the Oregon Coast (+0.8%), and Eastern Oregon (+0.7%) also added jobs.

Press releases for all Oregon areas are available here. 

Tuesday, May 22, 2018

April 2018 Employment and Unemployment in Oregon’s Counties

Wheeler County had Oregon’s lowest seasonally adjusted unemployment rate at 3.0 percent in April 2018. Other counties with some of the lowest unemployment rates in April included Benton (3.1%), Gilliam (3.2%), and Hood River (3.2%). Grant County registered the highest unemployment rate for the month at 7.2 percent.

Twelve of Oregon’s counties had unemployment rates at or below the statewide unemployment rate of 4.1 percent. Wheeler County saw its unemployment rate improve over the year by 1.4 percentage points, more than any other county. Klamath County saw its unemployment rate increase the most of any county over the past year, rising 0.5 percentage point to 6.3 percent. 

Total nonfarm payroll employment rose in five of Oregon’s six broad regions between April 2017 and April 2018. The largest job gains occurred in Central Oregon (+2.9%). Southern Oregon (+2.7%), the Willamette Valley (+2.1%), the Portland area (+1.3%), and the Oregon Coast (+1.2%) also added jobs. Eastern Oregon had no growth over the past year.

To learn more about the employment situation for your county, click here. To see the full press release, click here.

Monday, May 7, 2018

Employment in the Oregon's Fishing Industry

Oregon’s commercial fishing industry fell to about an average level in 2017. Harvests have been averaging $147 million (2017 dollars) per year since 2010 – after adjusting for inflation. Total landed value was $144 million in 2017. This was down from $152 million in 2016. The decrease was mainly due to the drop in the pink shrimp harvest, and the salmon harvest also fell. The pacific whiting (hake) harvest rose, and the crab and groundfish harvest also increased in 2017. Other fisheries combined for a modest decrease. Overall revenue dropped even though landed volume was up for the year.

There were an estimated 1,330 commercial fishers in Oregon on an annual average basis in 2017. This was down from 1,438 in 2016 and was not too surprising given the decrease in harvests.

Estimating employment in fishing is more difficult than measuring the harvests. Legislation in 1999 allowed most fishermen to be exempt from unemployment insurance coverage – the primary source of employment data. The Oregon Employment Department now estimates the number of fishers based on a combination of survey data and the number of commercial fish landings made. This method was new for 2014 and resulted in a lower employment estimate than before.

The estimated number of fishers varied from a high of 1,784 in July to a low of 520 in November. Five coastal counties – Clatsop, Lincoln, Coos, Curry, and Tillamook – had 96 percent of the total employment, based on where landings occur. Perhaps even more surprising is that some interior counties, such as Jefferson and Washington, had any commercial fishing employment. These jobs are often based on crayfish harvests. The most important fisheries for employment are crab, salmon, and albacore tuna. Commercial fishers harvested more than 100 different species in 2017.
To learn more about the commercial fishing landings and revenue, read the full article "Oregon’s Commercial Fishing in 2017" by Regional Economist Erik Knoder

Tuesday, April 24, 2018

March 2018 Employment and Unemployment in Oregon’s Counties

Wheeler County had Oregon’s lowest seasonally adjusted unemployment rate at 2.9 percent in March 2018. Other counties with some of the lowest unemployment rates in March included Benton (3.1%) and Hood River (3.2%). 

Eastern and Southern Oregon had higher unemployment rates in March 2018, which were still close to their record low unemployment rates since 1990. Grant County registered the highest unemployment rate for the month at 7.3 percent.

Ten of Oregon’s counties had unemployment rates at or below the statewide and national unemployment rate of 4.1 percent. Wheeler County saw its unemployment rate improve over the year by 1.4 percentage points, more than any other county. Josephine County saw its unemployment rate increase the most of any county over the past year, rising 0.8 percentage point to 5.3 percent.

To learn more about the employment situation for your county, click here. To see the full press release, click here.

Tuesday, March 27, 2018

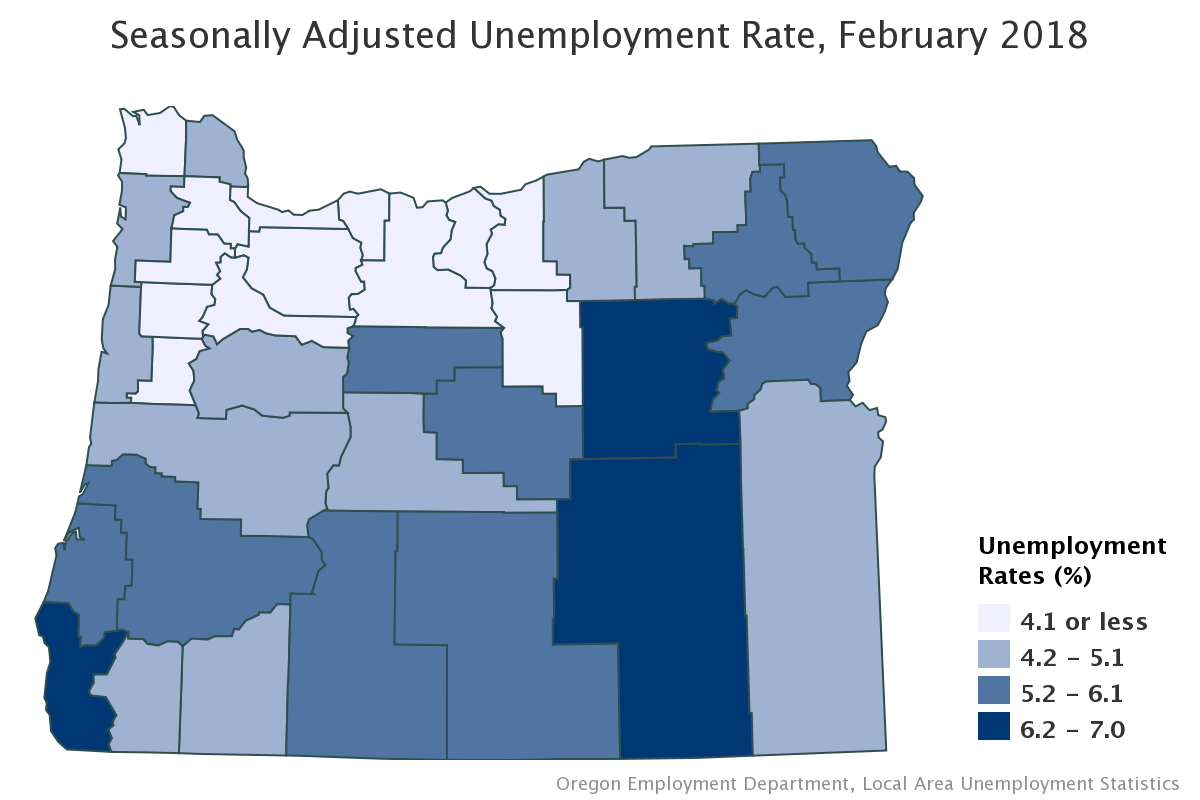
February 2018 Employment and Unemployment in Oregon’s Counties

Wheeler County had Oregon’s lowest seasonally adjusted unemployment rate at 2.8 percent in February 2018. Other counties with some of the lowest unemployment rates in February include Gilliam (2.9%) and Benton (3.1%). Grant County registered the highest unemployment rate for the month at 7.0 percent.

Thirteen of Oregon’s counties had unemployment rates at or below the statewide and national unemployment rate of 4.1 percent. Wheeler County saw its unemployment rate improve over the year by 1.6 percentage points, more than any other county. Deschutes County saw its unemployment rate increase the most of any county over the past year, 0.6 percentage point.

Total nonfarm payroll employment rose in all of Oregon’s six broad regions between February 2017 and February 2018. The largest job gains occurred in Central Oregon (+3.1%). Southern Oregon (+2.5%), the Willamette Valley (+1.8%), the Portland area (+1.6%), and Eastern Oregon (+1.1%) also saw growth. The Oregon Coast saw a slight job gain of 0.2 percent.
To learn more about the employment situation for your county, click here. To see the full press release, click here.