Pages

Showing posts with label Wages. Show all posts

Monday, March 8, 2021

Did Oregon’s Residential Real Estate Market Become More Affordable in the Pandemic?

Even before the onset of COVID-19 the fast growth in home prices over the past five years had many across the state concerned about housing affordability. In an unexpected turn we have seen a large increase in the demand for housing during this pandemic recession. The high demand has led to historically low inventories of residential real estate for many communities across the state. High demand and low inventory is leading to dramatic home price appreciation, further increasing concerns around housing affordability.

I developed a housing affordability index that looks at the monthly mortgage of the average house as a share of the average wage in a particular geography. Across the state, the average monthly mortgage at the end of 2020 was roughly 26% of the average monthly wage, a considerable decline from 29% the same time last year.


Affordability varies quite dramatically across the state. The least affordable of the communities highlighted was Hood River, where the average monthly mortgage accounted for 44% of the average monthly wage. The lack of affordability in places like Hood River or Bend are twofold. First, the average monthly wage of workers employed locally is lower than the statewide average, in Hood River’s case by more than $1,300 a month. Second, the average monthly mortgage was around $320 higher than the state. Bend also ranked poorly in housing affordability; the average monthly mortgage was around 35% of the average monthly wage. Surprisingly, the Portland Metro Area (Washington Co.) was generally more affordable than the state as a whole due to higher wages that helped to balance the relatively high housing costs. The Salem metro area also ranked relatively high on affordability, where the average mortgage was only around 24% of the average monthly wage.

A time-series of this housing affordability measure shows that concerns about affordability may be overstated. The low cost of borrowing alongside strong wage gains the past several years helped to counter, but not completely overcome, the growth in housing prices. Despite the fact that home prices are near or exceeding the peak from the last expansion, affordability remains notably higher than back in the mid-2000s for every community highlighted. In fact, the last year showed a trend towards the real estate market becoming more affordable, which is likely surprising to anyone who may be looking for a house today.

Low Interest Rates Drive Improvement in Affordability

The dramatic increase in the average wage over the past nine months is misleading as the average is rising due to the loss of low-wage jobs rather than real substantive wage gains. The reported 2020 wages were thrown out and wages were modeled using a three-year trend to check whether housing affordability was being held in check by the artificially high wage increases during the pandemic or by historically low interest rates. Did housing affordability change when modeling a lower average wage? Not much. In fact, housing still moved towards being more affordable even when dropping the average wage to something more consistent with what we likely would have seen had COVID not happened. The real driver in affordability today is interest rates. These historic low interest rates have held the dramatic increase in house prices largely in check. The average worker who buys the average house with today’s interest rates will spend a slightly smaller share of their income on that mortgage than they would have this time last year.

We all live in the real world and housing affordability is more complex than this simplified index. More expensive housing means buyers need a larger down payment. If you were saving to get a 20% down payment on your first house and you were looking at a $350,000 house you would need $70,000 saved. If you lived in someplace like the Bend metro area where home prices have risen more than 10% in the past year that $350,000 house would now likely cost around $390,000. That means your down payment now needs to be $78,000 to get to 20% and avoid mortgage insurance. Most people are not seeing wages increase fast enough to keep pace with these housing prices, which means they are falling behind on their savings goals. However, federal stimulus likely helped many prospective first-time buyers boost their savings.

Finally, this pandemic recession has not been an equal opportunity offender. Job losses have disproportionally impacted lower-wage workers. Due to high demand and low supply the more affordable homes in most markets have seen the largest price increases over the past year. The barrier to entry for first-time buyers is high and remains a distinct challenge for many Oregonians. The good news is that the combination of an increasing pace of new housing construction and a return to a more normal level of geographic mobility should lead to an increased supply of housing as we move further into 2021.

To learn more, read Regional Economist Damon Runberg's full article here


Monday, January 11, 2021

Oregon's Manufacturing Specialities

Manufacturing has a slightly larger than average footprint in Oregon (10.2% of employment compared with 8.5% nationally) and, despite relatively steeper losses leading up to and during the COVID-19 pandemic, is growing more quickly over the long run than the nation. Since its lowest employment level in March 2010, manufacturing employment in Oregon has grown by 12.0% compared with the nation’s 7.0%. Long-term growth in Oregon's manufacturing sector is projected to continue, with 5% growth expected between 2019 and 2029.

Computer and electronic components manufacturing comprises nearly 20% of the sector statewide compared with roughly 8% of national manufacturing employment. Wood product manufacturing also has a strong presence in Oregon, making up 12% of sector employment compared with 3% of the sector nationally.

A more detailed industry analysis shows just how diverse Oregon's manufacturing sector is. The largest detailed industry by far is the semiconductor and electronic components industry (30,400 jobs in 2019). It also pays far more on average than any other manufacturing industry at $149,300 compared with $71,400 across all manufacturing sectors.

True to Oregon’s long history in forestry, two of Oregon’s top industries are tied to our natural resources: veneer and engineered wood products (9,000 jobs) and sawmills and wood preservation (6,200 jobs). While employment in wood product manufacturing is but a fraction of what it was a few decades ago, these two industries combined play an influential role in Oregon’s manufacturing sector.

As more and more Oregon wines and beers hit shelves around the country and world, the winery and brewery industries are thrust into the spotlight. Both of these industries in Oregon have sizeable employment. Employment in wineries has risen steadily over the years, and is highly seasonal, due to employment spikes around harvest time. Brewery employment has skyrocketed in recent years as the craft beer industry has boomed. Oregon’s wineries and breweries pay relatively lower wages than the all-industry average at $37,000 and $41,000, respectively.

Oregon's manufacturing sector has a unique makeup, comprises a larger share of employment statewide than it does nationally, and is growing faster than the U.S. over the long-term. Long-term growth is projected to continue, with 5% growth projected between 2019 and 2029. 

To learn more about Oregon's manufacturing sector, read economist Sarah Cunningham's full article here

Wednesday, June 10, 2020

Oregon’s Minimum Wage Increases on July 1, 2020

Oregon’s minimum wage increases on July 1, 2020, but the raises won’t be the same across the state. The minimum wage increases to $13.25 per hour inside the Portland urban growth boundary, $11.50 per hour in nonurban counties, and $12.00 in other areas of the state. As U.S. consumer prices stayed flat over-the-year ending in May 2020, minimum wage workers will enjoy up to a 6.7 increase in their purchasing power.

Oregon’s minimum wage levels were set by Senate Bill 1532 in 2016. The minimum wage increases on July 1 each year through 2022. There are three tiers of step increases based on geography. Beginning in 2023, minimum wage in all tiers will be adjusted for inflation.
Oregon’s three minimum wages will be in the top seven state-level minimum wages in the nation. The highest minimum wage will be in the District of Columbia ($15.00), followed by Washington ($13.50), Massachusetts ($12.75), and California ($13.00). Oregon’s July 1 increase will set the standard minimum wage on par with minimum wage rates in Arizona, Colorado, and Maine ($12.00). The federal minimum wage will remain at $7.25 per hour.

A Look Back at Minimum Wage Jobs in 2019

Between July 1, 2019 and July 1, 2020, Oregon’s minimum wages were $12.50 per hour within the Portland urban growth boundary, $11.25 standard, and $11.00 in nonurban counties. Roughly 6.6 percent of all jobs paid minimum wage or less in Oregon in the third quarter of 2019.

Oregon’s metro area counties had a slightly smaller share of minimum wage jobs (6.6%) than its non-metro counties (7.0%). Among the metro area counties, Deschutes County had the lowest percentage of jobs (5.1%) paying minimum wage, followed by Marion County (5.4%) and Multnomah County (5.8%). Clackamas County had the highest share of jobs paying minimum wage among metro counties at 9.2 percent.

Sixteen counties had a share of minimum wage jobs at or below the statewide share of 6.6 percent. The smallest shares were in Hood River County (3.9%), Morrow County (4.0%), Gilliam (4.8%), and Deschutes County (5.1%). Counties with a higher share of minimum wage jobs tended to be in rural areas. Eastern Oregon had a greater share of minimum wage jobs than other areas of the state. The highest shares of minimum wage jobs were found in Wheeler (18.1%), Baker (12.6%), Harney (11.5%), Malheur (11.4%), and Grant County (10.9%).
Read economist Sarah Cunningham's full article here.
Thursday, January 9, 2020

Wage Disparity by Race and Ethnicity

Over the last decade, the wage disparity by race and ethnicity in Oregon has remained consistent. According to the U.S. Census Bureau’s Longitudinal Employer-Household Dynamics (LEHD), Asian and non-Hispanic white workers have the highest wages. In 2018, wages for black, American Indian, mixed-race, and Hispanic or Latino workers of any race ranged between $39,000 and $45,000 annually – at least $10,000 less than white workers and $20,000 less than Asian workers.

However, real wages have grown faster for Hispanic and Latino and black workers than for non-Hispanic white workers. On average, real wages for Oregon workers grew 13.1 percent from 2008 to 2018, an increase of $6,256. American Indian workers have seen the lowest real wage growth of 11.8 percent in the last decade. Real wages for all other racial and ethnic groups grew by at least 14 percent. Asian workers have seen the most real wage growth at 27 percent, an increase of $14,160 in their annual average wages.

This wage disparity is due in part to the industries of employment for each racial and ethnic group. The largest industry of employment for all groups is education and health services, with an annual average wage of $51,550 in 2018. However, the breakdown of employment after this industry varies. In aggregate, the second most common industry of employment for people of color is leisure and hospitality, which had the lowest annual average wages in 2018 ($22,754). In contrast, the second most common industry of employment for non-Hispanic white workers is professional and business services, with an annual average wage of $69,800. Manufacturing, which has one of the highest annual average wages in the state ($70,652), employs 18 percent of Asian workers, which may help explain Asian workers’ higher incomes.

Educational attainment is also a factor. The 2018 American Community Survey reported that 36 percent of non-Hispanic whites over 25 have a bachelor’s degree or higher, compared with 27 percent of people of color. However, 51 percent of Asian residents have a bachelor’s degree or higher, the highest of any race or ethnicity. Typically, those with higher education qualify for higher-paying jobs, which also factors into the higher annual average wages for Asian and non-Hispanic white workers.

As Oregon’s population continues to diversify, these patterns may change. Positive changes may depend on increasing access to education for people of color and creating pathways to employment in higher-wage fields.

To learn more, read economist Sarah Cunningham's full article here

Friday, January 3, 2020

Wage Inequality in Oregon: A Wide Gap

Over the past 28 years, the distribution of wage income in Oregon has continued to become more unequal. In 2018, employees who worked all four quarters of the year earned a total of nearly $89.3 billion in covered wages, an inflation-adjusted increase of more than $47 billion since 1990. The number of four-quarter workers rose by 63 percent during that time period, with the average four-quarter inflation-adjusted wage rising from $43,000 to $56,100. The gains in wage income, however, have not been evenly shared by all workers. High-wage workers' slice of the wage pie has increased in size, while that of low- and middle-wage workers has shrunk.

In 1990, the median wage of the top 1 percent of all four-quarter workers was 7 times that of the median for all four-quarter workers at an inflation-adjusted $250,800. By 2018, wages for the top 1 percent workers increased by 52 percent to $380,500. Meanwhile, the median wage for all workers increased just 14 percent over the same period. In 2018, the median wage of the top 1 percent of workers was 9 times the median for all workers ($40,979).


To learn more, read Special Projects Analyst Barbara Peniston's full article here.

Friday, November 1, 2019

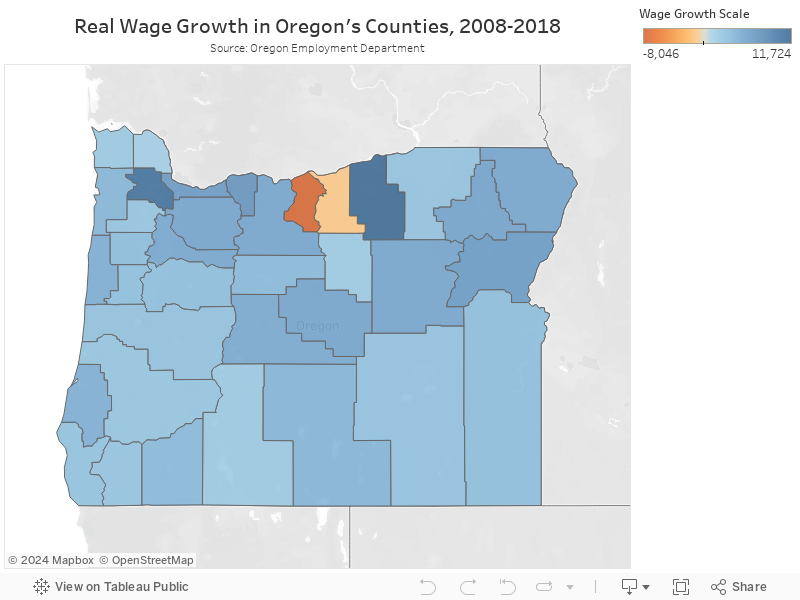
Most Oregon Counties Saw Real Wage Growth from 2008 to 2018

Most of Oregon’s counties had an increase in inflation-adjusted average wages from 2008 to 2018. Overall, the average wage for the entire state increased by $6,026 over those 10 years after adjusting for inflation.


Most of the statewide increase was driven by the large gains in Washington and Multnomah counties. These two counties in the Portland metro area are home to more than 1.4 million Oregonians (about one-third of the state’s population) and more than $51 billion in payroll (slightly over 50 percent of the state’s total). Washington County is home to several high-wage industries, including company headquarters and high tech manufacturing. Both of these industries have a disproportionately large presence in the county, and both have added thousands of jobs over the past 10 years.

Gilliam and Sherman counties lost ground on wages, and in both cases it seems to be related to the reduction in wind farm construction. In 2008, Sherman County had 96 jobs in construction that paid an average wage of over $114,000 per year. By 2018, employment had dropped to 64 jobs that paid about $77,000 per year.

Despite some losses, a majority of Oregon’s counties – 34 out of 36 – had 2018 wages that were higher than they were in 2008 even after adjusting for inflation.

To learn more, read Regional Economist Erik Knoder's full article here.

Friday, October 18, 2019

Differences in Workers' Employment, Education and Industry by Ethnicity

According to the 2013-2017 five-year ACS estimates (the most current available), Oregon had roughly 2.1 million people between the ages of 25 and 64. Of them, 236,000 were of Hispanic or Latino origin, while the state’s non-Hispanic population in the same prime working age range totaled 1.9 million. The non-Hispanic population includes Oregonians of any race (African-American, Asian, Native American, White, or any other race(s)) that did not self-identify as Hispanic or Latino.

Educational attainment differed widely between Hispanic and non-Hispanic prime working age populations. Almost two-thirds (63%) of the non-Hispanic population had some education beyond high school. Meanwhile, two-thirds (67%) of the Hispanic population had a high school diploma or less.


Labor Force Participation

Employment and labor force participation also varied notably between Hispanic and non-Hispanic populations. At all education levels, larger shares of the Hispanic prime working age population were in the labor force. The largest disparities occurred among those with less education. Nearly half (45%) of the non-Hispanic population with less than a high school degree sat out of the labor force, compared with 21 percent of Hispanic or Latino Oregonians in the same age group. Among those with at least some college education, shares of the population who were employed looked quite similar.

Education Pays

Hispanic and Latino workers ages 25 to 64 with a high school diploma or less were particularly concentrated in lower-wage industries. Annual wages for all jobs covered by Unemployment Insurance in Oregon averaged $52,400 in 2018. While roughly one-third (35%) of all non-Hispanic workers held jobs in sectors that paid below the all-industry average, nearly half (48%) of Hispanic workers did. As educational attainment increased, the distribution of industry employment looked similar by ethnicity.


Manufacturing and construction showed similar patterns for Hispanics and non-Hispanics. Comparable shares of both Hispanic and non-Hispanic prime-age workers across education categories held jobs in manufacturing. Larger shares of prime-age workers with a high school degree or less held jobs in construction compared with more educated workers.

Keep Learning for Higher Earnings

Overall, the portion of Oregonians ages 25 to 64 that participated in the labor force and held jobs increased along with educational attainment. Employed Oregonians with more education were also more likely to work in higher-wage industries. Larger shares of the Oregon’s Hispanic or Latino prime working age population had not earned a high school diploma. Hispanic and Latino workers were more concentrated in lower-paying industries. Additional data about the demographic and educational attainment characteristics of workers can be found on the IPUMS USA website, https://usa.ipums.org/usa/.

Read senior economic analyst Gail Krumenauer's full article here

Friday, July 19, 2019

More Than 40 Percent of Jobs Paid at Least $20.00 Per Hour in 2018

In 2018, the largest number of jobs was held by professional and business services (449,745 or 14.3% of the total jobs in Oregon). The leisure and hospitality industry ran not far behind, capturing 431,829 (13.8% of all) jobs that year. In terms of percent increase, that industry has rebounded more than any other (up 21.4%) since the recession a decade ago. Despite over-the-year gains, three broad industries – construction (down 3.5% from 2006), manufacturing (-5.1%), and financial activities (-8.6%) – have yet to regain all the jobs they lost during the recession.


The median hourly wage of jobs in all broad industries rose from $17.03 to $17.79 per hour in 2018 – a year-over-year increase of 4.5 percent, likely boosted by increases in the minimum wage. All individual broad industries saw their median wages increase. Leisure and hospitality recorded the largest over-the-year median wage increase, at 7.8 percent. The real (inflation-adjusted) change in median hourly wages are generally less impressive. They shrink the year-over-year all industries median hourly wage increase to 2.0 percent and leisure and hospitality’s increase to a still notable 5.2 percent.

Almost one-quarter (24.2%) of all 2018 jobs paid at least $30.00 per hour. Nearly 43 percent (1,349,020 jobs) paid at least $20.00 per hour; larger than the percentage (37.2%) that paid less than $15.00 per hour. All but the smallest hourly wage class posted job gains. The $15.00 to $19.99 category had the highest year-over-year percent increase in jobs at 12.0 percent. The latter increase is not surprising, given minimum wage increases and the concentration of job gains in professional and business services and leisure and hospitality. As of July 1, 2018, the lowest minimum wage in Oregon was $10.50 per hour. At the other end of the spectrum, the highest ($60.00 or more) wage class showed the second largest gain in numbers of jobs (11.0%). Nearly 10 percent of all jobs paid $50 or more per hour; the top two classes together also saw a 10 percent increase in number of jobs in 2018.


To learn more, read Special Projects Analyst Barbara Peniston's full article here.

Tuesday, June 11, 2019

A Look Back at Minimum Wage Jobs in 2018

Note: Some of the figures originally published in this blog post were revised on June 17, 2019.

Between July 1, 2018 and July 1, 2019, Oregon’s minimum wages were $12.00 per hour within the Portland urban growth boundary, $10.75 standard, and $10.50 in nonurban counties. Roughly 7.3 percent of all jobs paid minimum wage or less in Oregon in the third quarter of 2018.

The share of jobs paying minimum wage ranged from a low of 3.5 percent in Morrow County (279 jobs) to a high of 12.4 percent in Harney County (331 jobs). Multnomah County had 40,240 minimum wage jobs, which made up 7.1 percent of total jobs in the county.

With a larger concentration of jobs, metro areas also have more minimum wage jobs. Among the metro area counties, Deschutes County had the lowest percentage of jobs (5.7%) paying minimum wage among metro counties, followed by Marion County (5.8%) and Benton County (6.4%). Clackamas County had the highest share of jobs paying minimum wage among metro counties at 10.2 percent.

Seventeen counties had a share of minimum wage jobs at or below the statewide share of 7.3 percent. The smallest shares were in Morrow County (3.5%), Hood River County (4.1%), Deschutes and Clatsop counties (5.7%), and Marion County (5.8%). Counties with a higher share of minimum wage jobs tended to be in rural areas. Eastern Oregon had a greater share of minimum wage jobs than other areas of the state. The highest shares of minimum wage jobs were found in Harney (12.4%), Malheur (12.1%), Wheeler (11.8%), and Sherman (10.0%).
To learn more, read the full article written by State Employment Economist Nick Beleiciks.

Friday, June 7, 2019

Oregon's Minimum Wage Increases July 1, 2019

Oregon’s minimum wage increases on July 1, 2019, but the raises won’t be the same across the state. The minimum wage increases to $12.50 per hour inside the Portland urban growth boundary, $11.00 per hour in nonurban counties, and $11.25 in other areas of the state.

Oregon’s three minimum wages will be in the top nine state-level minimum wages in the nation. The highest minimum wage will be in the District of Columbia ($14.00), followed by Massachusetts and Washington ($12.00); Colorado and New York ($11.10); and Arizona, California, and Maine ($11.00). The federal minimum wage will remain at $7.25 per hour.

Oregon’s minimum wage levels were set by Senate Bill 1532 in 2016. The minimum wage increases on July 1 each year through 2022. There are three tiers of step increases based on geography. Beginning in 2023, minimum wage in all tiers will be adjusted for inflation. This means the minimum wage will maintain purchasing power after the last step increase in 2022.
To learn more, read the full article written by State Employment Economist Nick Beleiciks

See our report Oregon’s Minimum Wage Jobs: Facts, Figures, and Context for historical information about Oregon’s minimum wage jobs.

Wednesday, June 5, 2019

2019 Oregon Wage Data

The 2019 version of the Oregon Employment Department’s annual summary of occupational wage information is now available. Thanks to survey responses from employers around the state, wage scales for over 700 job categories have been calculated. Regional wage information is also available; however, wages are published only for those occupations that meet certain criteria for statistical reliability.

When we put all the data together, we can compute an all-occupations mean hourly wage in Oregon, which is $25.66. Average hourly wages in 2019 in Oregon range from $12.52 for ushers, lobby attendants, and ticket takers and up to $122.80 for general internists.


In addition to compiling average hourly wages, we publish occupational wage ranges. For example, nursing assistants earn an average of $16.54 per hour. The median (50th percentile) hourly wage for nursing assistants in Oregon is $16.05. At the low end (10th percentile), they earn $12.27 per hour and at the high end (90th percentile), they earn $22.15 per hour.

Many occupations employ a large share of part-time workers. In those cases, multiplying the hourly wage by 40 hours per week and then by 52 weeks per year could overstate actual annual income.

You can find a wealth of occupational information – including wages – by visiting www.QualityInfo.org. Go to the Jobs and Careers section and select Occupation and Wage Information.

Thursday, February 21, 2019

Higher Education and Earnings by Race in Oregon

About 17 percent of Oregon African Americans age 25 or older have a bachelor’s degree, That's slightly below the share of all Oregonians age 25 or older (21%). Another 12 percent of black residents have a graduate or professional degree, which is roughly the same as the statewide share (13%).

Another 37 percent of Oregon’s black residents over 25 have some college or an associate’s degree, a a slightly larger share than Oregon statewide (34%). African Americans also have a slightly larger share of population with less than a high school diploma, at 12 percent versus 9 percent of Oregonians statewide.

Average monthly earnings for Oregonians statewide was $4,355 in 2017. Asian residents had the highest average monthly earnings at $5,332, followed by white residents at $4,369. African American earnings averaged $3,635 monthly, 83 percent of the average statewide. Native Hawaiian or Other Pacific Islanders ($3,231), and American Indian or Alaska Natives ($3,122) had the lowest monthly earnings statewide.

To learn more about African Americans in the Oregon workforce, read the full article written by Workforce Analyst Shawna Sykes


Monday, December 31, 2018

Occupations with the Most Jobs Paying Less Than $12.00 per Hour

Oregon’s minimum wage levels were set by Senate Bill 1532 in 2016. The minimum wage increases on July 1st of each year through 2022. There are three tiers of step increases based on geography.

Oregon’s most recent minimum wage increase came on July 1, 2018, but the raises weren’t the same across the state. Minimum wage increased to $12.00 per hour inside the Portland urban growth boundary, $10.50 per hour in non-urban counties, and $10.75 in other areas of the state.

Minimum wage jobs are more common in some types of work. There are around 361,300 jobs in Oregon that pay $12.00 per hour or less. This represents 20 percent of all Oregon jobs.

Two occupations employ more than 30,000 workers with wages below $12.00 per hour: retail salespersons and cashiers. Food preparation and serving workers, along with waiters and waitresses, each have more than 20,000 workers with wages below $12.00. Dishwashers have the largest percentage of their total occupational employment making $12.00 per hour or less, with 78 percent of the jobs in this occupation below the threshold.
This article was written by Economist Anna Johnson

Tuesday, December 4, 2018

Fruit of the Vine: Oregon’s Grape and Wine Industry

As Oregon businesses struggled during the Great Recession (2007-2009) and the years to follow, the state’s grape and wine industry flourished. In 2007, there were 792 vineyards and 351 permitted or bonded wineries in the state; by 2009, that number had grown to 835 vineyards and 377 wineries. This growth has accelerated during the post-recessionary period, and by 2017, there were 1,144 vineyards and 769 Oregon wineries, of which 709 were permitted or bonded. Wine grapes ranked ninth on Oregon’s top 20 commodities list for 2017, valued at $171.7 million.

The Oregon Employment Department (OED) records counted 108 firms. For those 108 reporting vineyards, OED records showed an annual average employment of 1,179 with an annual average wage of $29,855. It should be noted that given the seasonal nature of growing, tending, and harvesting wine grapes, growers often use contract and migratory workers, who are not reported under the UI system. Thus, actual vineyard employment could be much higher.

As with vineyard employment data, OED records reflect only those enterprises participating in the UI program. In 2001, OED reported 65 wineries; by 2017, that number had increased to 329 – an increase of roughly 21 wineries per year. Between 2007 and 2009, the depths of the Great Recession, the number of reporting wineries increased from 144 to 170. Total payroll in Oregon’s wineries in 2017 was $110.7 million with an annual average wage of $34,997 (like vineyards, this includes seasonal and part-time workers).
To learn more about the grape and wine industry in Oregon, read Regional Economist Annette Shelton-Tiderman's full article

Thursday, October 25, 2018

Most Oregon Employers Have Fewer than 20 Employees

Nine out of 10 private-sector firms in Oregon had fewer than 20 employees in March 2018. Six out of 10 employed fewer than five.

Despite their quantity, smaller firms collectively account for a much smaller share of overall employment than their larger counterparts. For example, the 59.4 percent of firms with one to four employees represented 7.3 percent of covered employment in March 2018 and 6.2 percent of wages in the first quarter of 2018. On the other hand, the 0.3 percent of firms with at least 500 employees accounted for 27.4 percent of private-sector jobs and 35.4 percent of wages.
These distributions tend to remain stable from one year to the next, even as the overall number of firms, employees, and wages expands or contracts. This doesn’t mean that smaller firms are underperforming when it comes to job creation, or that larger firms are experiencing a bonanza. Size of firm data does not provide us with information about the dynamics of job growth. Instead, it offers a snapshot that can help us understand the roles of small and large firms in Oregon’s economy at a specific point in time.

Friday, October 12, 2018

Worker Access to Paid Leave Benefits

In the United States, 74 percent of workers have access to paid sick leave through their employers. About the same share has access to paid vacation (75%) and paid holidays (77%). This access varies between the public and private sectors. In private industry, 71 percent of workers have access to paid sick leave and more than three-quarters of workers have access to paid vacation and paid holidays. Among state and local government employees, access to paid sick leave (91%) far outweighs access to paid vacation and holidays (61% and 68%, respectively).

These figures come from the U.S. Bureau of Labor Statistics National Compensation Survey, which includes very little detail at the sub-national level. Oregon is grouped with the Pacific West region, which includes Alaska, California, Hawaii, Oregon, and Washington. Access to paid sick leave benefits is a bit more widespread in this area of the country compared with the national average.

Almost nine out of 10 workers in the Pacific West region have access to paid sick leave. Access to paid holidays and to paid vacation in the Pacific West matches the national average. Access to all paid leave benefits is more prevalent than the national average in the regional public sector, while the region’s private-sector workforce is more likely than the national average to have access to paid sick leave (86%) and very similar to the nation in terms of access to paid vacation and paid holidays.

Full-time workers – those working 35 hours per week or more at their primary job – are far more likely to have access to paid leave benefits than part-time workers. Eighty-five percent of full-time workers have access to paid sick leave, and even more have paid vacation and holidays. Among part-time workers, 40 percent have access to paid sick leave, 38 percent have paid vacation, and 43 percent have paid holidays.

Union-represented workers are more likely to have access to sick leave and slightly more likely to have paid holidays, but union representation doesn’t raise the access to paid vacation. Nine out of 10 union-represented workers had access to sick leave in March 2018, compared with 71 percent of non-union workers. Access to paid holidays reached 81 percent of union workers and 76 percent of non-union workers. The same share had access to paid vacation, at 75 percent in both union and non-union operations.

The workers with the lowest wages also have the least access to paid leave benefits through their employers. Access to paid sick leave has a direct positive relationship with earnings, with each step up in earnings quartile matched by improved access to paid sick leave. In contrast, for paid vacation and paid holidays, this relationship only holds for the shift between the lowest paid and the next quartile, with the highest half of earners having about as much access to paid vacation and paid holidays as the second 25 percent. 
For more information, read the full article written by Economist Jessica Nelson.

Wednesday, October 10, 2018

Who’s Driving Oregon’s Wage Growth?

By Damon Runberg

Wages in Oregon have been on the rise over the past three years. From fourth quarter 2014 to fourth quarter 2017, the quarterly average wage (smoothed and adjusted for inflation) rose by around 6.7 percent (+$800 per quarter). This is seemingly good news, right? This means that during that three-year period the average worker had more disposable income when accounting for the increased cost of goods and services.

At a recent presentation where I shared this good news about rising wages I was approached by a member of the audience; let’s call her Sue. Sue said, “I don’t know who is making that sort of growth in their wages, but it isn’t me and it is not anyone I know.” When dealing with millions of workers clearly Sue’s wage growth (or lack thereof) has little effect on the average wage. However, she made an important point. The average wage is not an individual story, but a rough aggregation of all payroll divided by the number of workers. It does not tell us who is seeing higher wages, only that payroll is up relative to the number of workers. This spurred me to ask if we can identify who is driving Oregon’s wage growth.

The Problem with the Average

Sue pointed out an important issue with averages as they can be notoriously misleading. She told me she had worked continually with the same employer the past three years, but she had seen no substantive wage growth. How common is Sue’s story among Oregon workers?

To answer this question I used wage records of Oregon workers between 2014 and 2017. These are employment and wage records by firm for all workers covered by unemployment insurance.

Who Is Contributing to Oregon’s Wage Gains?

The results of the analysis were quite unexpected. The expectation was that incumbent workers, like Sue, were not experiencing particularly notable wage growth. That assumption was wrong.

The real median hourly wage for those who changed their employer one or more times (the job hoppers) between 2014 and 2017 rose by 13.3 percent, very rapid growth. That represented a growth in median hourly wage of $2.92. As expected the incumbent workers posted a slower pace of wage growth, however it was only marginally slower growth than the job hoppers. During the three-year period incumbent workers, those who stayed continually employed with the same firm, saw real median hourly pay rise by 11.7 percent with nearly an identical growth in the median hourly rate (+$2.87 an hour).
Read the full article written by Damon Runberg, regional economist for Crook, Deschutes, Jefferson, Klamath, and Lake counties. 

Thursday, October 4, 2018

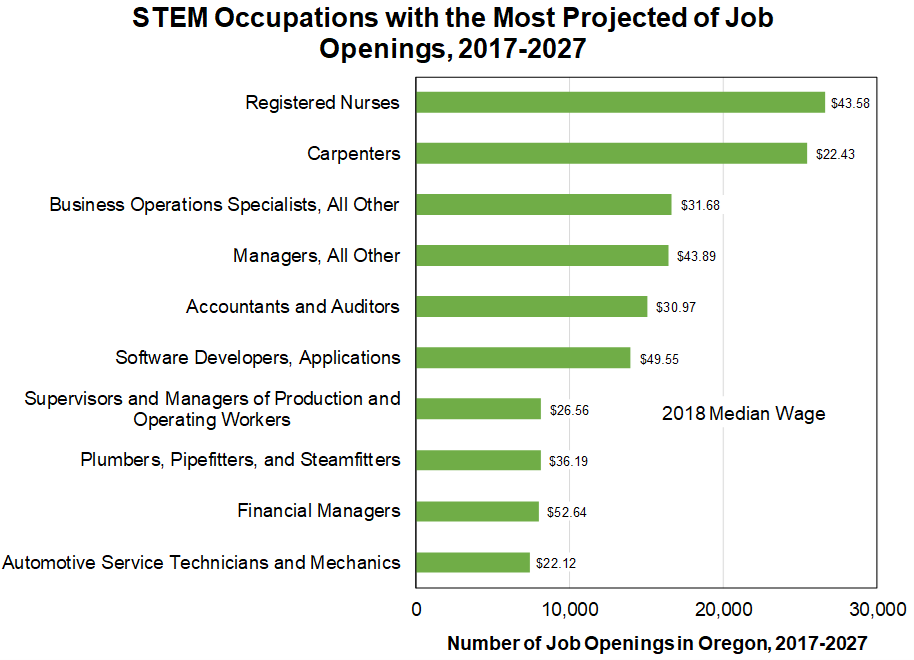
10-Year Occupational Projections for STEM Jobs

Twenty-two percent of jobs in Oregon fall into the STEM category (science, technology, engineering, and mathematics). You can view the relationship between employment and wages of STEM occupations in the chart-based STEM Employment and Wage Tool.

Most STEM jobs require education and training to learn the skills and knowledge for the job. The typical entry-level education for almost three-quarters (71.3%) of STEM job openings is postsecondary training or higher. Nearly half (47.3%) of STEM job openings require a bachelor’s degree.

Looking at all projected job openings in Oregon, 76 percent of openings that require a doctoral or professional degree are STEM jobs. Forty-nine percent of openings that require a bachelor’s degree and 60 percent that require an associate’s degree are STEM jobs.

More than 400,000 job openings due to both growth in the occupation and the need to replace workers who leave the occupation (for retirement, or move to another type of work, for example) are expected from 2017 to 2027. The growth rate for STEM jobs during this period is 15 percent, which is higher than the growth rate for all occupations of 12 percent. Only 19 out of 286 STEM occupations are expected to decline during the decade.

The Oregon Employment Department has wage data available for 257 of the 286 STEM occupations analyzed in this blog post. Of these 257 STEM occupations, 235 occupations have a higher median wage than Oregon’s median wage for all occupations ($19.09 per hour) in 2018. 
For more information on STEM occupations, read the full article written by Economist Anna Johnson.

Thursday, September 6, 2018

Exploring Living Wages in Oregon

In a recent report prepared for Worksystems entitled The Self-Sufficiency Standard for Oregon 2017, wage measures for self-sufficiency for each Oregon county were developed. This Self-Sufficiency Standard is a wage adequate to pay for housing, childcare, food, miscellaneous items, health care, transportation, taxes, and leave some cash for an emergency savings fund.

The self-sufficiency wage budget is “bare bones” with just enough income to meet basic needs, and no extras. So the food budget includes groceries prepared at home. Transportation includes commuting to work and day care plus one trip to the grocery store per week, no more. It assumes that you have employer-provided health insurance but that you may have to pay a portion of the monthly premium or pay some charges out-of-pocket. There’s no budget for having pizza delivered, going to the state fair, or even a subscription to Netflix. It’s just the essentials, no more.

Self-sufficiency standard wages vary greatly based on family size, location, and family make-up. For instance, a household of one adult does not have childcare expenses while a household with multiple small children may spend up to half of their budget for housing and childcare combined.

When we examine the self-sufficiency standard wage for a family with two adults, one infant, and one preschooler statewide, only 25 percent (about 528,000) of Oregon jobs meet the self-sufficiency wage threshold. The self-sufficiency standard calculates how much income families need to make ends meet without public or private assistance. Colors show hourly wage range necessary for a family of two adults, one infant and one preschooler to be self-sufficient while size of circles shows concentration of jobs in the county.
For this family of four, Washington County is the most expensive of all Oregon counties to live in, requiring $85,022 annually just to meet basic needs, and more than twice the cost for the same family to live in Malheur County ($38,253) which has the lowest self-sufficiency standard wage. Multnomah County is second highest ($84,235), followed by Clackamas ($82,329), Hood River ($73,436), and Benton counties ($72,810). The difference in living expenses from the highest cost county to the lowest is influenced heavily by the much higher costs of childcare, housing, and taxes in the metro area counties. The counties with the lowest self-sufficiency wage for this same family of four are Malheur ($38,253), Grant ($40,805), Gilliam ($41,669), Lake ($42,492), and Josephine ($42,791).

Learn more in the full article written by Northwest Oregon's Workforce Analyst Shawna Sykes

Monday, August 27, 2018

Where Women Work and How Much They Earn

Nearly 873,000 jobs at Oregon businesses or state and local governments were held by women in 2016. Women represent 49 percent of employment in Oregon, but the share of jobs held by women varies considerably by industry.

Women’s average earnings were $3,444 per month in 2016, which was 69 percent of the $4,963 average monthly earnings of men. The average woman brings home $1,500 a month less than the average man. Like employment, the earnings of women relative to men vary by industry.

The average monthly paycheck for women is about two-thirds the average monthly paycheck for men, but this fact is not a very useful measure of gender pay inequality. Average monthly earnings figures do not take into account other factors affecting pay, such as total hours worked and hourly wages. Adjusting for the number of hours worked narrows the earnings gap between women and men, but still does not account for other factors that can significantly affect pay.

Women’s Average Earnings by Industry

Average monthly earnings of women were lower than that of men in every industry. The ratio of women’s to men’s earnings ranged from a relatively close 86 percent in accommodation and food services to a disparate 56 percent in arts, entertainment, and recreation, and in finance and insurance. There are many factors behind these disparities in earnings, such as the number of hours worked and the relative wages of occupations with higher concentrations of women, but that information is not available from this data source.
Women working in Oregon’s health care and social assistance sector have an average monthly paycheck of $3,696, which is just 62 percent of the men’s average. Women working in finance and insurance have a higher average paycheck than women in most other industries, but their earnings pale in comparison to what men are bringing in. With earnings just 56 percent of men’s, women in finance and insurance receive an average of $3,800 a month less than what men are making.

The smallest disparity is in accommodation and food services, where women’s earnings average 86 percent that of men’s. The large share of minimum wage earners in this industry likely contributes to this relative earnings equality. That near equity has a cost though, as average paychecks for both women and men were lower in accommodation and food services than in any other major industry.

Learn about women's employment by industry in "Where Women Work and How Much They Earn" by state employment economist Nick Beleiciks.