Pages

Showing posts with label job gains. Show all posts

Tuesday, November 23, 2021

October 2021 Employment and Unemployment in Oregon’s Counties

In October 2021, all of Oregon’s 36 counties experienced over-the-month decreases in their unemployment rates. Thirteen counties experienced a 0.4 percentage point decrease over the month including Clatsop, Columbia, Coos, Curry, Douglas, Gilliam, Jefferson, Josephine, Lincoln, Tillamook, Crook, Marion, and Multnomah counties.

Grant County had Oregon’s highest seasonally adjusted unemployment rate in October at 6.4%. Other counties with some of the highest unemployment rates included Klamath (6.3%), Crook (6.2%), Curry (6.1%), and Lincoln (6.1%).

Wheeler County registered the lowest unemployment rate for the month at 2.8%. Other counties with some of the lowest unemployment rates in October were Benton (3.4%), Washington (3.7%), and Malheur (3.9%) counties. Twelve counties had unemployment rates at or below the nationwide rate of 4.6%. Eleven of those counties also had unemployment rates at or below the statewide rate of 4.4%.
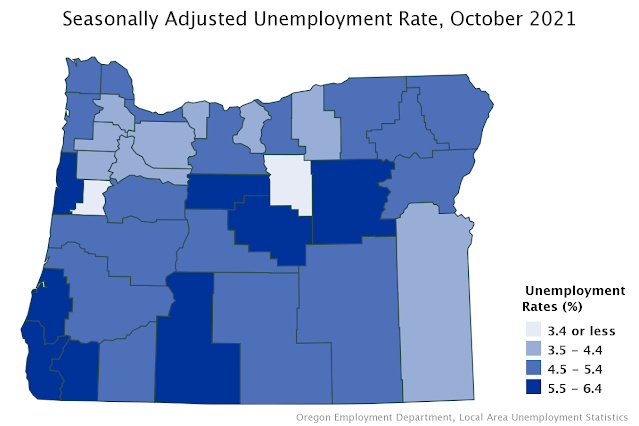
A map of the seasonally adjusted unemployment rate in October 2021 for Oregon by county. Unemployment rates ranged from a low of 2.8% in Wheeler County to a high of 6.4% in Grant County.

Total nonfarm payroll employment increased in all six of Oregon’s broad regions between October 2020 and October 2021. Most areas still have room to recover from pandemic job losses; the state has now recovered 74% of jobs lost in March and April 2020. The largest job increases since October 2020 occurred in the Willamette Valley (3.8%). The Portland 5 area (3.4%) and Central Oregon (3.1%) also experienced large over-the-year employment increases. Southern Oregon, the Coast, and Eastern Oregon regions added 2.5%, 2.0%, and 1.9%, respectively.
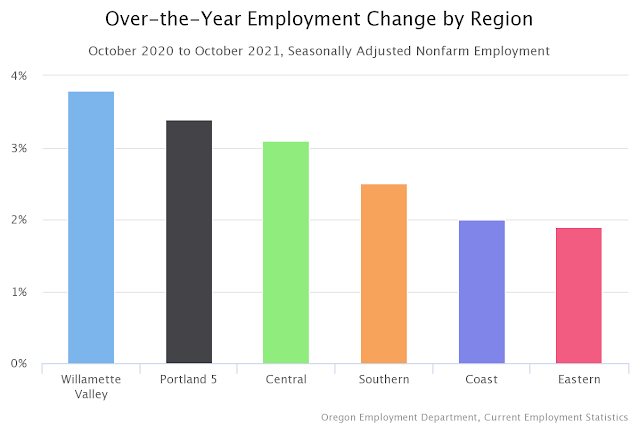
Bar chart titled "Over-the-Year Employment Change by Region" in Oregon, seasonally adjusted nonfarm employment data from October 2020 to October 2021

Next News Releases

The Oregon Employment Department will release statewide unemployment rate and industry employment data for November 2021 on Tuesday, Dec. 14, 2021. The November 2021 county and metropolitan area unemployment rates will be released on Tuesday, Dec. 21, 2021.

Read the original press release here

Tuesday, August 24, 2021

July 2021 Employment and Unemployment in Oregon’s Counties

In July 2021, all but one of Oregon’s 36 counties experienced over-the-month decreases in their unemployment rates. The unemployment rate in Lake County experienced no over-the-month change to its unemployment rate. Jackson and Multnomah counties saw the largest decrease over the month with a change of -0.5 percentage point.

Lincoln County had Oregon’s highest seasonally adjusted unemployment rate in July at 7.2%. Other counties with some of the highest unemployment rates included Crook (7.0%), Curry (7.0%), Klamath (7.0%), and Grant (6.9%) counties.

Wheeler County registered the lowest unemployment rate for the month at 3.2%. Other counties with some of the lowest unemployment rates in July were Benton (4.1%), Malheur (4.3%), and Sherman (4.4%) counties. Fifteen counties had unemployment rates at or below the nationwide rate of 5.4%, and 12 counties had unemployment rates below the statewide rate of 5.2%.

Total nonfarm payroll employment increased in all six of Oregon’s broad regions between July 2020 and July 2021. Most areas still have room to recover from pandemic job losses; the state has now recovered 70% of jobs lost in March and April 2020. The largest job increases since July 2020 occurred on the Coast (6.2%). Southern Oregon (4.9%), the Willamette Valley (4.8%), and Central Oregon (4.6%) also experienced large over-the-year employment increases. Eastern Oregon and the Portland-5 regions added 3.6% and 3.5%, respectively.
Read the original press release here.

Friday, October 2, 2020

Health Care and Social Assistance to Lead Long-Term Employment Growth in Oregon

Oregon’s total employment will grow by 181,800 jobs between 2019 and 2029, according to new projections from the Oregon Employment Department. The projections point to modest job growth between 2019 and 2029, although many job openings are expected due to the need to replace workers who leave their occupations.

In 2019, there were 2,120,000 jobs in Oregon. The 9 percent increase in employment between 2019 and 2029 includes private-sector gains of 156,400 jobs, 16,500 jobs in government, and an additional 8,900 gain in jobs for self-employed Oregonians.

Big Industries Add the Most Jobs
Private health care and social assistance will add 46,300 jobs, the most of any sector statewide. It’s followed by professional and business services with 33,000 additional jobs in 2029. There may be little surprise seeing health care and professional and business services among the top industries adding jobs, as they are two of the largest industries in the state. It’s notable that in addition to their size, these are also the fastest-growing industries.

Fast growth in health care and social assistance (15%) can be attributed to the growth and aging of the state’s population. Health care will account for one out of every five new jobs created in Oregon by 2029. Within health care and social assistance, ambulatory health care services (20%), such as doctor and dentist offices, chiropractors, physical and speech therapists, and other specialists, and nursing and residential care facilities (17%) are expected to grow much faster than hospitals (10%).

Professional and business services growth (13%) will be driven by gains in professional and technical services such as computer systems design (26%) and management of companies and enterprises (18%). Management of companies and enterprises includes corporate offices headquartered in Oregon.

Construction is the third-fastest growing industry, as it is expected to grow by 11 percent between 2019 and 2029. Demand for construction will be driven by population and economic growth, low residential vacancy rates and associated rising prices. Residential building construction is expected to increase by 14 percent adding 2,600 jobs. Nonresidential building construction should increase by 12 percent adding 1,400 jobs. Building equipment contractors are projected to add 3,400 jobs, a gain of 11 percent. This includes contractors for plumbing, heating, air conditioning, electrical and other wiring installations. Building finishing contractors, which includes contractors for drywall and insulation, flooring, and finish carpentry, are projected to add 1,300 jobs (8%).

Read Projections Economist Felicia Bechtoldt's full article or check out our projections page for additional information.