Pages

Tuesday, July 26, 2022

June 2022 Employment and Unemployment in Oregon’s Counties

In June, unemployment rates declined in 18 of Oregon’s 36 counties. Unemployment rates in 17 counties did not decline, but held steady over the month. The unemployment rate increased in Umatilla County. Fourteen counties had unemployment rates at or below the statewide and nationwide rate of 3.6% in June.

Klamath and Grant counties had Oregon’s highest seasonally adjusted unemployment rate (5.2%) in June. Other counties with relatively high unemployment rates were Curry (4.8%), Crook (4.7%), Josephine (4.7%), and Lincoln (4.7%). Wheeler County registered the lowest unemployment rate (2.8%) in June. Other counties with some of the lowest unemployment rates in June included Benton, Hood River, Sherman, and Washington, at 2.9% each.
Map of seasonally adjusted unemployment rate by county in Oregon for June 2022. Grant and Klamath counties had Oregon’s highest seasonally adjusted unemployment rate (5.2%) in June. Wheeler County registered the lowest unemployment rate (2.8%) in June.
Between June 2021 and June 2022, total nonfarm employment rose in each of the six broad regions across Oregon. The Willamette Valley region experienced the fastest job growth over the year at 3.8%. Employment also grew at a relatively fast pace in the five Portland-metro counties (3.4%) and Central Oregon region (3.3%). Growth occurred at a slower pace along the Coast (1.6%), in Southern Oregon (0.7%), and in Eastern Oregon (0.5%).
Bar chart of Over-the-Year Employment Change in Oregon by Region from June 2021 to June 2022. Between June 2021 and June 2022, total nonfarm employment rose in each of the six broad regions across Oregon. The Willamette Valley region experienced the fastest job growth over the year at 3.8%. Employment also grew at a relatively fast pace in the five Portland-metro counties (3.4%) and Central Oregon region (3.3%). Growth occurred at a slower pace along the Coast (1.6%), in Southern Oregon (0.7%), and in Eastern Oregon (0.5%).

Next News Releases

The Oregon Employment Department will release statewide unemployment rate and industry employment data for July 2022 on Wednesday, Aug. 17, 2022. The July 2022 county and metropolitan area unemployment rates will be released on Tuesday, Aug. 23, 2022.

Tuesday, April 19, 2022

March 2022 Employment and Unemployment in Oregon’s Counties

In March, unemployment rates declined in 35 of Oregon’s 36 counties. Wheeler County’s unemployment did not decline, but held steady over the month. Fifteen counties had unemployment rates at or below the statewide rate of 3.8% in March.

Klamath County had Oregon’s highest seasonally adjusted unemployment rate (5.3%) in March. Other counties with relatively high unemployment rates were Curry (5.1%), Lincoln (5.0%), and Grant (5.0%). Benton County registered the lowest unemployment in March, at 2.9%. Other counties with some of the lowest unemployment rates in March included Hood River (3.0%), Wheeler (3.0%), and Washington (3.1%).

Map of seasonally adjusted unemployment rate by county in Oregon for March 2022. Klamath County had the highest unemployment rate at 5.3%. Benton County had the lowest unemployment rate at 2.9%.
Between March 2021 and March 2022, total nonfarm employment rose in each of the six broad regions across Oregon. The five Portland metro counties in Oregon had combined job growth of 4.2% over the year, the fastest rate of any region. Employment also grew at a relatively fast pace in the Central Oregon region (3.8%) and the Willamette Valley (3.7%). Growth occurred at a slower pace in Eastern Oregon (1.8%), Southern Oregon (1.1%), and along the Coast (0.4%).
Bar chart of over-the-year employment change in Oregon by Region from March 2021 to March 2022. All regions experienced OTY increases in employment. The Portland-5 region experienced the largest job increases at 4.2% followed by Central Oregon (3.8%) and the Willamette Valley (3.7%). Slower growth occurred in Eastern Oregon (1.8%), Southern Oregon (1.1%), and along the Coast (0.4%).

Next News Releases

The Oregon Employment Department will release statewide unemployment rate and industry employment data for April 2022 on Wednesday, May 18, 2022. The April 2022 county and metropolitan area unemployment rates will be released on Tuesday, May 24, 2022.

Read the original press release here


Tuesday, March 29, 2022

February 2022 Employment and Unemployment in Oregon’s Counties

In February 2022, 35 of Oregon’s 36 counties experienced over-the-month decreases in their unemployment rates. Wheeler County experienced no over-the-month change in its unemployment rate. Five counties experienced a 0.3 percentage point decrease or more over the month including Gilliam, Grant, Hood River, Jefferson, and Union counties. 

Klamath County had Oregon’s highest seasonally adjusted unemployment rate in February at 5.5%. Other counties with some of the highest unemployment rates included Grant (5.4%), Curry (5.3%), Crook (5.2%), and Lincoln (5.2%). 

Benton and Wheeler counties registered the lowest unemployment rate for the month at 3.0% each. Other counties with some of the lowest unemployment rates in February were Hood River (3.2%), Washington (3.3%), and Sherman (3.4%). Sixteen counties had unemployment rates at or below the statewide rate of 4.0%. Twelve counties also had unemployment rates at or below the nationwide rate of 3.8%.

Map of seasonally adjusted unemployment rate by county in Oregon for February 2022. Klamath County had the highest unemployment rate at 5.5%. Benton and Wheeler counties had the lowest unemployment rate at 3.0% each.
Total nonfarm payroll employment increased in all six of Oregon’s broad regions between February 2021 and February 2022. Central Oregon has recovered from pandemic job losses. All other areas still have room to recover. The largest job increases since February 2021 occurred in the Central Oregon (5.5%) region. The Portland 5 (5.3%) and Willamette Valley (4.1%) regions also experienced large over-the-year employment increases. Growth occurred at a slower pace in other regions: Eastern Oregon (3.1%), Southern Oregon (1.8%), and the Coast (1.6%).

Bar chart of over-the-year employment change in Oregon by Region from Feb. 2021 to Feb. 2022. All regions experienced OTY increases in employment. Central Oregon experienced the largest job increases at 5.5% followed by Portland 5 (5.3%) and Willamette Valley (4.1%). Slower growth occurred in Eastern Oregon (3.1%), Southern Oregon (1.8%), and the Coast (1.6%)
Next News Releases
The Oregon Employment Department will release statewide unemployment rate and industry employment data for March 2022 on Wednesday, April 13, 2022. The March 2022 county and metropolitan area unemployment rates will be released on Tuesday, April 19, 2022.

Read the original press release here.

Tuesday, March 8, 2022

January 2022 Employment and Unemployment in Oregon’s Counties

In January 2022, 25 of Oregon’s 36 counties experienced over-the-month decreases in their unemployment rates. Five counties experienced a 0.2 percentage point decrease or more over the month including Clatsop, Deschutes, Grant, Harney, and Jefferson counties.

Grant County had Oregon’s highest seasonally adjusted unemployment rate in January at 5.7%. Other counties with some of the highest unemployment rates included Klamath (5.6%), Crook (5.5%), Curry (5.5%), and Lincoln (5.4%).

Wheeler County registered the lowest unemployment rate for the month at 3.0%. Other counties with some of the lowest unemployment rates in January were Benton (3.1%), Washington (3.4%), and Hood River (3.5%). Seventeen counties had unemployment rates at or below the statewide rate of 4.3%. Twelve counties also had unemployment rates at or below the nationwide rate of 4.0%.
Map of seasonally adjusted unemployment rate by county in Oregon for January 2022. Grant County had the highest unemployment rate at 5.7%. Wheeler had the lowest unemployment rate at 3.0%.
Total nonfarm payroll employment increased in all six of Oregon’s broad regions between January 2021 and January 2022. Most areas still have room to recover from pandemic job losses. The largest job increases since January 2021 occurred in the Central Oregon (7.0%) region. The Portland 5 (5.5%) and Willamette Valley (5.1%) regions also experienced large over-the-year employment increases. Growth occurred at a slower pace in other regions: the Coast (3.2%), Southern Oregon (3.1%), and Eastern Oregon (3.0%).
Bar chart of over-the-year employment change in Oregon by Region from Jan. 2021 to Jan. 2022. All regions experienced OTY increases in employment. Central Oregon experienced the largest job increases at 7.0% followed by Portland 5 (5.0%) and Willamette Valley (5.1%). The Coast, Southern, and Eastern Oregon experienced slower growth.
Next News Releases

The Oregon Employment Department will release statewide unemployment rate and industry employment data for February 2022 on Tuesday, March 22, 2022. The February 2022 county and metropolitan area unemployment rates will be released on Tuesday, March 29, 2022.

Read the original press release here.


Tuesday, January 25, 2022

December 2021 Employment and Unemployment in Oregon’s Counties

In December 2021, all of Oregon’s 36 counties experienced over-the-month decreases in their unemployment rates. Eight counties experienced a 0.3 percentage point decrease or more over the month including Clatsop, Crook, Deschutes, Grant, Hood River, Jefferson, Klamath, and Wasco counties.

Grant County had Oregon’s highest seasonally adjusted unemployment rate in December at 5.9%. Other counties with some of the highest unemployment rates included Klamath (5.7%), Crook (5.6%), Curry (5.6%), and Lincoln (5.5%).

Wheeler County registered the lowest unemployment rate for the month at 2.8%. Other counties with some of the lowest unemployment rates in December were Benton (3.1%), Washington (3.4%), and Hood River (3.6%). Twelve counties had unemployment rates at or below the statewide rate of 4.1%. Ten counties also had unemployment rates at or below the nationwide rate of 3.9%.
Oregon county map entitled "Seasonally Adjusted Unemployment Rate, December 2021". The unemployment was the highest in Grant County (5.9%). The unemployment rate was lowest in Wheeler County (2.8%).
Total nonfarm payroll employment increased in all six of Oregon’s broad regions between December 2020 and December 2021. Most areas still have room to recover from pandemic job losses. The largest job increases since December 2020 occurred in the Central Oregon (6.5%) region. The Willamette Valley (6.0%) and Portland 5 area (5.4%) also experienced large over-the-year employment increases. Southern Oregon, the Coast, and Eastern Oregon regions added 2.6%, 2.8%, and 2.8%, respectively.
Bar chart entitled "Over-the-Year Employment Change by Region: Dec. 2020 to Dec. 2021, Seasonally Adjusted Nonfarm Employment" All Oregon regions experienced OTY job growth. Central Oregon saw the largest increase at 6.5%. Eastern Oregon experienced the smallest increase at 2.8%.
Next News Releases
The Oregon Employment Department will release statewide unemployment rate and industry employment data for January 2022 on Tuesday, March 8, 2022. The January 2022 county and metropolitan area unemployment rates will be released on Tuesday, March 8, 2022.

Read the original press release here.


Tuesday, December 21, 2021

November 2021 Employment and Unemployment in Oregon’s Counties

In November 2021, 35 of Oregon’s 36 counties experienced over-the-month decreases in their unemployment rates. Seventeen counties experienced a 0.3 percentage point decrease or more over the month including Baker, Clackamas, Clatsop, Coos, Crook, Curry, Gilliam, Klamath, Multnomah, Tillamook, Union, Wasco, Yamhill, Hood River, Deschutes, Lane, and Lincoln counties.

Grant County had Oregon’s highest seasonally adjusted unemployment rate in November at 6.2%. Other counties with some of the highest unemployment rates included Klamath (6.0%), Crook (5.9%), Curry (5.8%), and Lincoln (5.7%).

Wheeler County registered the lowest unemployment rate for the month at 2.8%. Other counties with some of the lowest unemployment rates in November were Benton (3.2%); Washington (3.5%); and Clackamas, Malheur, Sherman, and Yamhill (3.8% each). Twelve counties had unemployment rates at or below the nationwide and statewide rate of 4.2%.
Map entitled "Seasonally Adjusted Unemployment Rate, November 2021" for Oregon's counties. The unemployment rate was the highest in Grant County (6.2%) and lowest in Wheeler County (2.8%)
Total nonfarm payroll employment increased in all six of Oregon’s broad regions between November 2020 and November 2021. Most areas still have room to recover from pandemic job losses; the state has now recovered roughly three-quarters of jobs lost in March and April 2020. The largest job increases since November 2020 occurred in the Willamette Valley (4.5%). The Portland 5 area (3.7%) and Central Oregon (3.5%) also experienced large over-the-year employment increases. Southern Oregon, Eastern Oregon, and the Coast regions added 2.2%, 2.1%, and 1.9%, respectively.
Bar chart entitled "Over-theYear Employment Change by Region, November 2020 to November 2021, Seasonally Adjusted Nonfarm Employment". Over-the-year employment increased in all six of Oregon's broad regions. The Willamette Valley saw the largest increase at 4.5%.
Next News Releases

The Oregon Employment Department will release statewide unemployment rate and industry employment data for December 2021 on Wednesday, Jan. 19, 2021. The December 2021 county and metropolitan area unemployment rates will be released on Tuesday, Jan. 25, 2021.

Read the original press release here

Tuesday, November 23, 2021

October 2021 Employment and Unemployment in Oregon’s Counties

In October 2021, all of Oregon’s 36 counties experienced over-the-month decreases in their unemployment rates. Thirteen counties experienced a 0.4 percentage point decrease over the month including Clatsop, Columbia, Coos, Curry, Douglas, Gilliam, Jefferson, Josephine, Lincoln, Tillamook, Crook, Marion, and Multnomah counties.

Grant County had Oregon’s highest seasonally adjusted unemployment rate in October at 6.4%. Other counties with some of the highest unemployment rates included Klamath (6.3%), Crook (6.2%), Curry (6.1%), and Lincoln (6.1%).

Wheeler County registered the lowest unemployment rate for the month at 2.8%. Other counties with some of the lowest unemployment rates in October were Benton (3.4%), Washington (3.7%), and Malheur (3.9%) counties. Twelve counties had unemployment rates at or below the nationwide rate of 4.6%. Eleven of those counties also had unemployment rates at or below the statewide rate of 4.4%.

A map of the seasonally adjusted unemployment rate in October 2021 for Oregon by county. Unemployment rates ranged from a low of 2.8% in Wheeler County to a high of 6.4% in Grant County.

Total nonfarm payroll employment increased in all six of Oregon’s broad regions between October 2020 and October 2021. Most areas still have room to recover from pandemic job losses; the state has now recovered 74% of jobs lost in March and April 2020. The largest job increases since October 2020 occurred in the Willamette Valley (3.8%). The Portland 5 area (3.4%) and Central Oregon (3.1%) also experienced large over-the-year employment increases. Southern Oregon, the Coast, and Eastern Oregon regions added 2.5%, 2.0%, and 1.9%, respectively.

Bar chart titled "Over-the-Year Employment Change by Region" in Oregon, seasonally adjusted nonfarm employment data from October 2020 to October 2021

Next News Releases

The Oregon Employment Department will release statewide unemployment rate and industry employment data for November 2021 on Tuesday, Dec. 14, 2021. The November 2021 county and metropolitan area unemployment rates will be released on Tuesday, Dec. 21, 2021.

Read the original press release here

Saturday, November 6, 2021

Oregon Jobs Projected to Increase 16% by 2030

Oregon’s total employment is projected to grow by 317,600 jobs between 2020 and 2030, according to new projections from the Oregon Employment Department. The projections point to historically high job growth between 2020 and 2030 and accounts for recovery from low employment levels in 2020 due to the COVID-19 pandemic and its associated recession. In addition, many job openings are expected due to the need to replace workers who leave their occupations.  


In 2020, there were 1,998,400 jobs in Oregon. The projected 16% increase in employment between 2020 and 2030 includes private-sector gains of 283,500 jobs, growth of 25,700 jobs in government, and an additional 8,300 self-employed Oregonians. 

Beyond gains associated with the economic recovery from the COVID-19 recession and anticipated economic growth, another 2,197,200 job openings will be created by 2030 to replace workers who retire, leave the labor force for other reasons, or make a major occupational change. Together, the number of job openings due to economic recovery, job growth, and replacements will total 2,514,800. 

Learn more about Oregon Employment Projections on our projections page.


Tuesday, October 26, 2021

September 2021 Employment and Unemployment in Oregon’s Counties

In September 2021, all but three of Oregon’s 36 counties experienced over-the-month decreases in their unemployment rates. The unemployment rates in Deschutes, Lake, and Wallowa counties remained unchanged. Lincoln County saw the largest decrease over the month with a decline of 0.4 percentage point.

Klamath and Grant counties had Oregon’s highest seasonally adjusted unemployment rate in September at 6.6%. Other counties with some of the highest unemployment rates included Lincoln (6.5%), Curry (6.5%), Crook (6.5%), and Jefferson (6.1%) counties.

Wheeler County registered the lowest unemployment rate for the month at 2.9%. Other counties with some of the lowest unemployment rates in September were Benton (3.6%), Washington (4.0%), Sherman (4.0%), and Malheur (4.1%) counties. Eleven counties had unemployment rates at or below the nationwide rate of 4.8%. The same 11 counties also had unemployment rates at or below the statewide rate of 4.7%.
Map of seasonally adjusted unemployment rates by county in Oregon, September 2021. Unemployment rates were highest in Klamath and Grant counties at 6.6%. Wheeler County had the lowest unemployment rate at 2.9%.

Total nonfarm payroll employment increased in all six of Oregon’s broad regions between September 2020 and September 2021. Most areas still have room to recover from pandemic job losses; the state has now recovered 72% of jobs lost in March and April 2020. The largest job increases since September 2020 occurred in the Willamette Valley (5.0%). Southern Oregon (2.9%), Central Oregon (2.9%), and the Coast (2.8%) also experienced large over-the-year employment increases. The Portland 5 and Eastern Oregon regions added 2.6% and 2.1%, respectively.
Bar chart of seasonally adjusted over-the-year employment change by region in Oregon from Sept. 2020 to Sept. 2021. All regions experienced over-the-year employment increases. The Willamette Valley region experienced the largest change at 5.0%. Eastern Oregon experienced the smallest at 2.1%.
Next News Releases

The Oregon Employment Department will release statewide unemployment rate and industry employment data for October 2021 on Tuesday, Nov.16, 2021. The October 2021 county and metropolitan area unemployment rates will be released on Tuesday, Nov. 23, 2021.

Read the original press release.

Tuesday, October 19, 2021

Oregon's Uneven Jobs Recovery

This morning the Employment Department released the September unemployment rate and jobs numbers for Oregon. After averaging monthly gains of 10,200 jobs from January through August, nonfarm payrolls lost 200 jobs in September.

The jobs recovery looks quite different across different areas of the economy. About half of local government payroll jobs are in public K-12 schools and higher education. In September, local government fell short of its typical hiring level by 3,700 jobs. Local government has struggled to regain jobs since the pandemic recession, only adding back about 26% of the jobs lost in spring 2020.

The hotels, restaurants, bars, and entertainment places in Oregon's leisure and hospitality sector have also struggled to get back to pre-pandemic job levels. They've been hiring at a good pace, with an average of 3,500 in monthly job gains so far in 2021. Leisure and hospitality has regained 62% of the jobs lost in spring 2020. The tremendous size of the task of adding back the 111,000 jobs lost last spring remains a challenge though -- especially during a time of record job openings and employer competition for workers. 

Some industries have fully recovered and now expanded beyond their February 2020 job levels. Professional and technical services added 1,200 jobs in September. These companies, which provide a mix of architectural, engineering, computer design, and other services, had 6,000 more jobs in September than they did before the recession.

Transportation, warehousing, and utilities employment surged during 2020, which was a stark contrast to most of the rest of Oregon's economy. The sector added 1,000 jobs in September, and has 3,900 more jobs than it did before the recession. As of September, the banks, insurance, real estate and rental companies that make up the financial activities sector had also regained 99% of the jobs lost in spring 2020.

Despite the pause in overall job gains, Oregon's unemployment rate continued to improve. The rate was 4.7% in September, a significant decline from 5.0% in August. More information about Oregon's employment situation can be found in the full news release.

Tuesday, September 21, 2021

August 2021 Employment and Unemployment in Oregon’s Counties

 In August 2021, all but two of Oregon’s 36 counties experienced over-the-month decreases in their unemployment rates. The unemployment rates in Harney and Wallowa counties remained unchanged.  Clatsop County saw the largest decrease over the month with a decline of 0.5 percentage point.

Lincoln County had Oregon’s highest seasonally adjusted unemployment rate in August at 6.9%. Other counties with some of the highest unemployment rates included Crook (6.8%), Klamath (6.8%), Curry (6.7%), and Grant (6.7%) counties. 

Wheeler County registered the lowest unemployment rate for the month at 3.0%. Other counties with some of the lowest unemployment rates in August were Benton (3.8%), Sherman (4.1%), and Malheur (4.4%) counties. Sixteen counties had unemployment rates at or below the nationwide rate of 5.2%, and 10 counties had unemployment rates below the statewide rate of 4.9%.


Total nonfarm payroll employment increased in all six of Oregon’s broad regions between August 2020 and August 2021. Most areas still have room to recover from pandemic job losses; the state has now recovered 72% of jobs lost in March and April 2020. The largest job increases since August 2020 occurred in the Willamette Valley (4.5%). The Coast (4.1%), Southern Oregon (3.6%), and Central Oregon (3.2%) also experienced large over-the-year employment increases. Eastern Oregon and the Portland-5 regions added 2.8% and 2.6%, respectively.


Tuesday, August 24, 2021

July 2021 Employment and Unemployment in Oregon’s Counties

In July 2021, all but one of Oregon’s 36 counties experienced over-the-month decreases in their unemployment rates. The unemployment rate in Lake County experienced no over-the-month change to its unemployment rate. Jackson and Multnomah counties saw the largest decrease over the month with a change of -0.5 percentage point.

Lincoln County had Oregon’s highest seasonally adjusted unemployment rate in July at 7.2%. Other counties with some of the highest unemployment rates included Crook (7.0%), Curry (7.0%), Klamath (7.0%), and Grant (6.9%) counties.

Wheeler County registered the lowest unemployment rate for the month at 3.2%. Other counties with some of the lowest unemployment rates in July were Benton (4.1%), Malheur (4.3%), and Sherman (4.4%) counties. Fifteen counties had unemployment rates at or below the nationwide rate of 5.4%, and 12 counties had unemployment rates below the statewide rate of 5.2%.

Total nonfarm payroll employment increased in all six of Oregon’s broad regions between July 2020 and July 2021. Most areas still have room to recover from pandemic job losses; the state has now recovered 70% of jobs lost in March and April 2020. The largest job increases since July 2020 occurred on the Coast (6.2%). Southern Oregon (4.9%), the Willamette Valley (4.8%), and Central Oregon (4.6%) also experienced large over-the-year employment increases. Eastern Oregon and the Portland-5 regions added 3.6% and 3.5%, respectively.
Read the original press release here.

Tuesday, August 17, 2021

Unemployment Rate Drops to 5.2% as Employers Add 20,000 Jobs in July

Oregon's jobs recovery strengthened in July. Oregon added 20,000 jobs to nonfarm payrolls, and the unemployment rate dropped significantly to 5.2%.

Leisure and hospitality added 7,100 jobs in July. That means one out of three jobs added over the month was at Oregon's restaurants, hotels, and entertainment places. In the first seven months of 2021, Oregon's leisure and hospitality sector added as many jobs as it did in five years (61 months) leading up to the pandemic. 

Government added 12,800 jobs in July. These were related to public education. School employment was already much lower than normal in July, and they had fewer layoffs than we'd generally expect this time of year. When we expect schools to let go of bus drivers and cafeteria workers for the summer, but there were already not as many working at schools recently, it can look like a big gain.

Oregon's unemployment rate improved from 5.6% in June to 5.2% in July. This was a significant drop that happened because many unemployed people found jobs over the month. Oregon's unemployment rate hit its all-time peak of 13.2% in April 2020. In the 15 months since then, the rate has fallen by 8.0 percentage points.

 
More information about Oregon's employment situation is available in the full news release, or in the video recap

Tuesday, August 10, 2021

Hiring and Retention in a Tight Labor Market

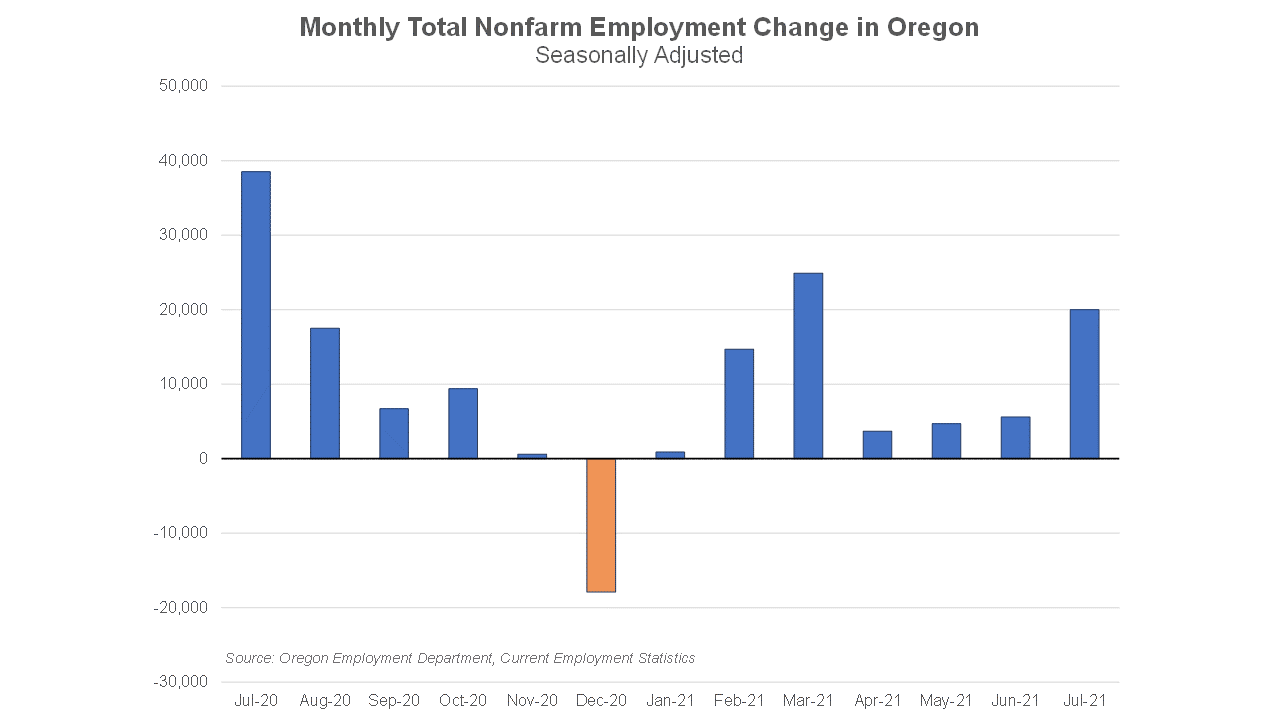
Oregon’s economy is continuing to recover and change rapidly. We’re 17 months past the initial pandemic recession downturn, and we’ve regained nearly two out of three jobs lost in spring 2020. In the first six months of 2021, Oregon employers added about the same number of jobs as in the 22 months leading up to the pandemic. For reference: when we were 17 months into the Great Recession, we hadn’t recovered at all. The job losses were still mounting. The speed and shape of this economic recovery looks different and has been happening much faster than what we’ve seen in the past.

While many businesses have done a lot of hiring, many others are having a hard time adding as many workers as they'd like right now. Their difficulty is made up of two general parts: competition due to widespread hiring, and a relatively low supply of available workers.

Both Oregon and the U.S. saw a record level of job openings in recent months. In Oregon, private businesses reported 98,000 job vacancies at any given time between April and June. That’s nearly 50% higher than we’ve ever seen in the eight-year history of our job vacancy survey. That spring hiring was happening in all sectors of Oregon's economy, and across more than 240 different types of occupations.


This record hiring demand also comes at a time when there's a 
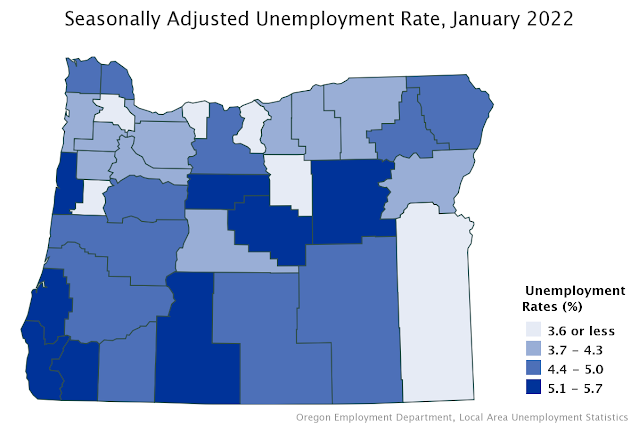
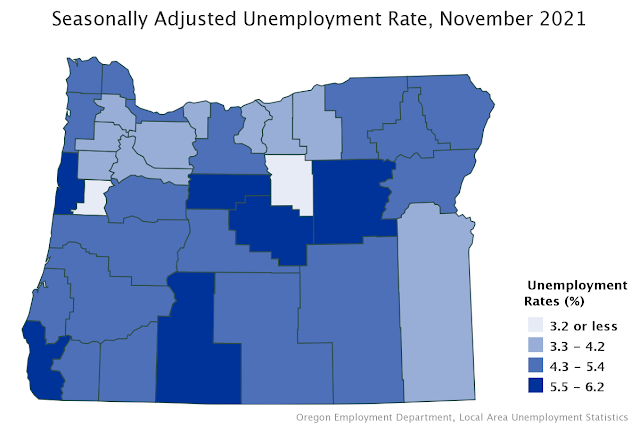
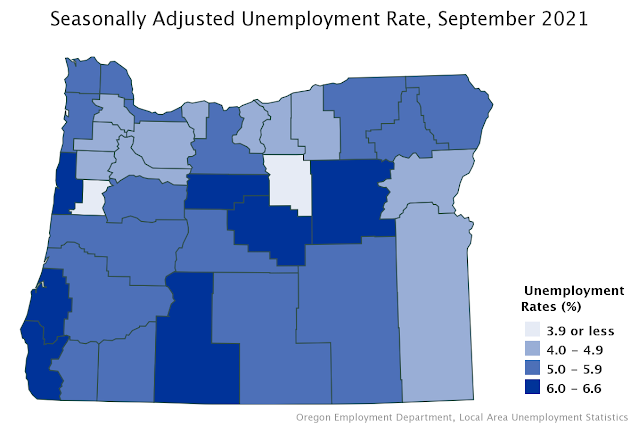
relatively low available workforce.  Oregon’s unemployment rate was 5.6% in June. That’s relatively low by historical standards; the long-run unemployment rate has been 6.8% in Oregon.

There are also still many people who are having a hard time taking part in this recovery. There were 32,500 Oregonians between April and June who had a COVID-related issue that prevented them from looking for work. That could be their own underlying health conditions, or those parents who are in a bind finding child care or waiting until fully in-person school returns. While this trend has improved, in recent days the COVID-19 Delta variant has been on the rise.


Taken together, the strong hiring, relatively low unemployment, and barriers keeping some workers on the sidelines are creating a tight labor market. Employers have responded to tight labor market conditions in a number of ways.

Wages
For one, employers have raised wages. Real (or inflation-adjusted) average starting wages rose by more than 2% in Oregon over the past year. Businesses have raised their wages for existing workers too. Real average hourly earnings for all workers also rose by more than 2% compared to the pre-recession level.

Benefits and Perks
Not every employer can raise wages. Some have found other ways to recruit and retain talent. The labor market was also tight prior to the pandemic. In 2018 we surveyed private employers to ask about the benefits they offered employees. Three out of five offered health benefits, and half offered retirement benefits. One out of 10 of employers offering health insurance, and one out of five offering retirement benefits, cited worker hiring and retention advantages related to those offerings.

Half of Oregon's private firms offered paid holidays, and half offered paid vacation days. One-third offered at least one of the following: flexible work schedules, production or performance bonuses, paid professional development training, and life insurance.

Relaxing Experience Requirements
When the labor market has been tight in recent years, some employers have loosened their previous work experience requirements. This spring, about half (53%) of all job vacancies required previous work experience. Nearly 19,000 of the 98,000 job vacancies this spring required less than one year of prior experience. The largest number of these job openings requiring less than one year of experience were for restaurant servers, retail sales staff, nursing assistants, restaurant cooks, and food prep workers. When it doesn’t pose a safety risk, and employers are able to, loosening previous experience requirements can increase the number of people who qualify for their job openings.

Recruitment Intensity
In tight labor markets, employers tend to layer help wanted signs with other efforts such as referral incentives, signing bonuses, posting with online job boards, and working with recruiters outside of their immediate geographical area. This includes listing job openings with WorkSource Oregon, where tens of thousands of workers have been registering in the job matching system.

Any layering employers can do with their hiring and retention strategies can help them find and keep more workers in a tight labor market.


Tuesday, August 3, 2021

Professional and Business Services A Varied and Growing Sector

Professional and business services has added a lot of jobs in recent years. It is a large and varied industry super sector that includes everything from law offices, engineering services, and computer systems design to company headquarters, temporary help firms, call centers, and janitor services. It is separated into three sectors: professional and technical services, management of companies, and administrative and waste services. 


Table with sub-industry breakouts for Professional and Business Services in Oregon. The overall super sector employed 241,890 in 2020, roughly 13% of total employment in the state.


The overall super sector employed 241,890 in 2020, roughly 13% of total employment in the state. The largest sector was professional and technical services, which included 17,830 firms with 98,339 workers. The largest industries in professional and technical services are computer systems design and related services with 16,735 workers, engineering services with 11,098 workers, and accounting and bookkeeping services with 11,005 workers. Wages in this sector are high, averaging $79,760 in 2020.


Graph on industries within Professional and Business Services.


Professional and business services is expected to continue adding jobs into the future. Oregon Employment Department projections for 2019 through 2029 show it is expected to add 33,000 jobs for a 13% growth rate. At the industry level, computer systems and design is expected to add the most jobs at 4,400 and grow the fastest at 26%.


Tuesday, July 20, 2021

June 2021 Employment and Unemployment in Oregon’s Counties

In June 2021, all but two of Oregon’s counties experienced over-the-month decreases in their unemployment rates. The unemployment rate in Sherman County did not change, and in Lake County it increased by 0.1 percentage point. Clatsop, Multnomah, and Wheeler counties saw the largest decrease over the month with a change of -0.4 percentage points.

Lincoln County had Oregon’s highest seasonally adjusted unemployment rate in June at 7.7%. Other counties with some of the highest unemployment rates included Crook (7.4%), Curry (7.3%), Klamath (7.2%), and Grant (7.2%) counties. 

Wheeler County registered the lowest unemployment rate for the month at 3.5%. Other counties with some of the lowest unemployment rates in June were Benton (4.4%), Sherman (4.6%), and Malheur (4.6%) counties. Nineteen counties had unemployment rates at or below the nationwide rate of 5.9%, and 14 counties had unemployment rates below the statewide rate of 5.6%.


Total nonfarm payroll employment increased in all six of Oregon’s broad regions between June 2020 and June 2021. Most areas still have room to recover from pandemic job losses; the state has now recovered 64% of jobs lost in March and April 2020. The largest job increases since June 2020 occurred on the Coast (7.1%). Central Oregon (6.5%), the Willamette Valley (5.2%), and Eastern Oregon (4.4%) also experienced large over-the-year employment increases. Southern Oregon and the Portland-5 regions added 3.8% and 3.5%, respectively.


Thursday, July 15, 2021

Oregon's Beveridge Curve Shows Unusually High Job Vacancy Rate

This week we've shared the latest unemployment and labor force numbers from June, and job vacancy totals during spring 2021 in Oregon. Oregon's unemployment rate dropped to 5.6% in June. At any given time during spring 2021, Oregon's private employers had 98,000 job openings. This makes for a good opportunity to check in on the Beveridge Curve.

The Beveridge Curve shows the relationship between the job openings rate (vacancies/labor force) and the unemployment rate. Note the labor force includes all those ages 16+ who are either employed, or out of work but are available and able to take a job if offered to them, and have actively sought work in the past four weeks.

At first glance the Beveridge Curve is just a messy squiggle. That squiggly line does generally tend to move in predictable ways though. If it moves out to the right, but stays high, this could mean those who are unemployed are not finding jobs as well, when there seem to be plenty of vacancies. This is where we were in spring 2020.

When the curve moves up and to the left over time, that means the unemployment rate is low, and there's strong hiring demand relative to the size of the labor force. This appears to be the situation we're in now. Hiring demand is strong, like it was at its last peak in summer 2017. Now, both Oregon and the nation have recently hit the highest level of job openings on record, while the unemployment rate is relatively low. The U.S. Beveridge Curve looks much like Oregon's.

What does that mean?
In spring 2020, about 9 out of 10 layoffs at the beginning of the pandemic recession were temporary. Those workers probably expected to get called back to work by their employer once businesses could resume operations, and weren't likely seeking another job.

At the same time, higher-wage earners were more likely to keep their jobs in the downturn, and most households received direct federal fiscal stimulus. That translated to people continuing to buy stuff, and a different mix of stuff (e.g., home goods rather than vacations). That helped keep up the hiring demand to make and/or deliver that stuff, even with higher unemployment.

Now, the Beveridge Curve and the economic picture look quite different. Oregon's unemployment rate has recovered about five times faster during this recovery than it did following the onset of the Great Recession. We closed many otherwise thriving businesses for public health and safety, to prevent the spread of COVID-19. The first wave of re-opening shows in the dramatic shift of the Beveridge Curve to the left, during what was likely a surge of recalls during the summer and fall of 2020. Unemployment declined significantly, while job vacancies didn't surge relative to the labor force. 

After a pause in both aspects of the Beveridge Curve over the winter -- and an economic "freeze" period -- unemployment has continued to decline in 2021. Meanwhile, the number of job vacancies skyrocketed.

What is driving our current, really high point on the curve?
As with everything else this year, there are likely many factors at play -- at the same time -- and it's hard to tell just how much to attribute to each one. Here's a (not necessarily exhaustive) list of possibilities:

  • There are still some people sitting out the labor force due to COVID-19 concerns. While this has eased from 45,000 in the winter of 2021 down to 32,500 in the spring, that's still a sizeable number of people not included in the labor force. This could include parents in a bind until in-person school starts up this fall, the immunocompromised, among others. It also shifts the Beveridge Curve a little further to the left than it would otherwise be.
  • There's a lot of pent-up demand to get out, and a lot of pent up savings and/or federal stimulus that went to households throughout 2020 and in spring 2021. More demand for goods, services, and travel means employers need to hire more, pushing up job openings.
  • Nationally, we know that the quits rate has recently been at the highest point we've ever seen. If someone quits their job, it creates a job opening to replace them.
  • Retirements are likely on the upswing again. As with a quit, when someone retires, it creates a replacement opening...and also means one less person in the labor force looking for work.
  • Are employers also doing some "preemptive posting?" If you already know it's going to be hard to hire in the coming months, do you get those upcoming job openings out there now to try to build a candidate pool?
  • What about enhanced unemployment benefits? We know that in winter 2021, on average, regular unemployment benefits were full wage replacement (about 103%) relative to the earnings of what those receiving benefits were earning at their pre-pandemic jobs. From January to June, the number of Oregonians receiving any kind of ongoing unemployment benefits fell by 30%. The resumption of job search registration and upcoming re-implementation of active work search requirements in July should diminish any remaining labor force disincentives related to benefits.

The Beveridge Curve shows a current labor market dynamic in Oregon that continues to be incredibly competitive for hiring. Employers have already added 57,800 jobs in the first half of this year. Leading up to the pandemic, it took Oregon 22 months to add about that many jobs. Rapid hiring and barriers holding some out of the labor force are contributing to ongoing labor shortages.

More information about Oregon's job vacancy survey is available at https://www.qualityinfo.org/pubs. Questions about Oregon's Beveridge Curve can be sent to Gail.K.Krumenauer@oregon.gov.

Wednesday, July 14, 2021

Spring 2021 Hiring Among Oregon Private Employers

Oregon businesses reported 97,800 vacancies in spring 2021. Total job openings increased 77% from the winter and 130% from spring 2020. This is the highest number of job vacancies seen in Oregon since the beginning of this survey in 2013. The previous high was 66,600 vacancies in summer 2017. The record high level of job vacancies is not unique to Oregon right now. The number of private-sector job openings in the U.S. totaled 8,995,000 in April 2021, beating the previous high seen in October 2018 (7,055,000) significantly.

Most openings in the spring were for full-time, permanent positions. Health care and social assistance topped the industry list in spring, with 22,200 vacancies. This has been the sector with the most vacancies 20 of the past 22 quarters. The leisure and hospitality industry had 19,900 vacancies, with 55% full-time positions and 7% requiring education beyond high school.

Hiring demand was widespread throughout industries and occupations. Four industries experienced record high vacancies: health care and social assistance, leisure and hospitality, retail trade (10,500 vacancies), and other services (7,000 vacancies). A majority of employers in every industry reported their vacancies as difficult to fill. Overall, 71% of vacancies were considered difficult to fill, another record high for this series.

Employers reported vacancies in more than 240 different occupations. The occupations with the most vacancies in spring 2021 were: retail salespersons (5,500 vacancies), maids and housekeeping cleaners (4,800 vacancies), personal care aides (3,700 vacancies), and waiters and waitresses (3,300 vacancies).

The average starting wage reported in spring was $18.44, a 3% inflation-adjusted increase from spring 2020. Total vacancies were up 130% from the level last spring at the height of pandemic restrictions. The number of vacancies offering a starting wage below $15 per hour increased the slowest, at 64%. The number of vacancies offering between $15 and $25 per hour more than doubled (+187%), as did vacancies paying above $25 per hour (+174%).

Learn more about job vacancies here.

Tuesday, July 13, 2021

Oregon Adds 7,500 Jobs, Unemployment Rate Drops to 5.6% in June

Oregon's unemployment rate continued its gradual improvement in 2021, dropping to 5.6% in June. This reflects more Oregonians getting back on the job. Nonfarm payrolls added 7,500 jobs in June.

Oregon has regained 64% of the jobs lost in spring 2020, compared with 70% for the U.S. While that still leaves quite a gap to return to pre-pandemic employment levels, the pace of hiring has been relatively fast in 2021. Oregon added 57,800 jobs in the first half of the year. Leading up to the pandemic, it took 22 months for Oregon to add about that many jobs.

In June, private health care and social assistance added the most jobs (+2,400). Other services -- which includes barber shops, hair salons, repair services, and others -- added 1,700 jobs over the month. Leisure and hospitality resumed hiring, adding 1,000 jobs.

While most sectors still have fewer jobs than before the pandemic, two private industries have more jobs now than they did in February 2020. Transportation, warehousing, and utilities is 4,400 jobs (or 6%) above its pre-pandemic employment level. Professional and technical services employs 3,100 (or 3%) more than before the pandemic recession.

More information about Oregon's employment situation is available in the video recap and the full news release.

Wednesday, July 7, 2021

Disparate Impacts of the Pandemic Recession in Oregon

The pandemic recession came upon a healthy economy with record high total employment and a record-low unemployment rate in spring 2020. Within two months’ time, Oregon lost 286,000 jobs and unemployment spiked to an all-time high of 13.2%. Job losses were not distributed evenly, affecting some industries and workers to a greater degree. These disparate employment impacts are detailed in a new report released by the Employment Department today. (Check out the podcast version too!)

By industry, three service-related sectors bore the brunt of the pandemic. Leisure and hospitality was impacted the most by far – losing half of its employment, or about 110,000 jobs between February and April 2020. The other hardest-hit sectors initially were other services – things like barber shops and hair salons, tattoo parlors – and also the education sector.

Leisure and hospitality in particular employed more women, more of Oregon’s young workers, and more Black, Indigenous, and workers from communities of color than Oregon’s economy overall. Other hard-hit sectors also tended to have more women and more low-wage workers. These are the Oregonians who experienced disparate job impacts of the pandemic recession in 2020.

These impacts are reflected in changes in unemployment claims activity during the pandemic. Regular unemployment (UI) claims activity rose dramatically across all demographics in Oregon. That said, the volume increased to an even greater degree for women and for younger workers.

Although workers of Hispanic or Latino origin were more likely to be working in leisure and hospitality than other sectors, their claims volume did not increase to a greater degree than for non-Hispanic workers. There's a combination of possible reasons: it could be Hispanic or Latino workers were less likely to be laid off, or that they were laid off but less likely to seek unemployment benefits, or possibly did seek benefits but had some difficulty accessing them. It's also noteworthy that their over-representation in leisure and hospitality was not as pronounced as for all young workers (who made up 27% of sector employment), or women's in education (where they held two out of three jobs).

The focus of any economic downturn often falls first on those who lost their livelihoods. The pandemic recession also created disease exposure risks to those who remained working at in-person or high-contact jobs. Much like those who were more likely to suffer pandemic-related job losses, data suggest that lower-wage earners, younger workers, and workers from communities of color who remained employed appear to have had relatively less opportunity to telecommute. This creates another disparate impact of the pandemic on the workforce.

More information about the disparate job impacts of the pandemic recession can be found in the full report.