Pages

Friday, April 29, 2016

Students and Online Education in Oregon

It is well known that a significant number of college students are enrolling in something called “online” or distance education – never having to attend face-to-face classes. These students are comfortable communicating through technology and managing their learning without having to show up at a particular place and time. These students are often older with careers and families and want more control over their life and education.

According to the Higher Education Coordinating Commission, the annual number of students attending Oregon’s public universities has grown from 109,003 in 2004-05 to 131,645 in 2014-15, or by 21 percent. This growth in student enrollment has been surpassed by the growth in the number of students taking online courses.

The number of students taking at least one online course has grown by 141 percent – from 14,074 (12.9%) in 2004 to 33,896 (25.7%) in 2014. The number of university students taking only online classes also increased from 2,306 in 2004 (2.1%) to 15,129 (11.5%) in 2014. Conversely, the percentage of university students not taking any online courses has been declining from 92,623 (85.0%) in 2004 to 82,620 (62.8%) in 2014.

Oregon’s Community College student enrollment has fallen faster than online enrollment. Total student enrollment fell from 353,945 in 2006-07 to 307,503 in 2014-15 (-13.1%). During this same period, the number of students taking any online courses increased from 57,453 to 67,437, or by 17.4 percent.

Distance education has made higher education more accessible – especially to working adults, caregivers, students with disabilities, and others who have schedules and responsibilities that are incompatible with attendance in traditional, face-to-face classroom instruction. Throughout the past 10 years, student enrollment in online courses continued to grow at a higher rate than overall student enrollment in colleges and universities. There still are some challenges, though, as outlined by the Instructional Technology Council (ITC) which is a non-profit organization that represents nearly 400 institutions offering distance education courses in the United States, Canada, and around the world. The challenges cited by ITC include:
  • Colleges need to offer better preparation for first-time online students so they will be ready to learn on day one.
  • The lack of computer and internet access for a portion of the population severely impacts students’ ability to access online offerings.
  • Student retention in online courses tends to be 8 percentage points lower than that of face-to-face instruction, according to ITC. Online students need to be self-disciplined to succeed. Many students underestimate how much time online coursework requires and others fall behind due to responsibilities of work and/or families.
To learn more about online education in Oregon and the U.S., read Workforce Analyst Lynn Wallis' article "Growth in Distance Learning Outpaces Total Enrollment Growth."

Wednesday, April 27, 2016

High Labor Force Participation in Portland and the Columbia Gorge

After several years of decline, Oregon's labor force participation rate has stabilized over the past few years, and increased in recent months. Today we're taking a look at the county level to see how labor force participation rates vary across the state.

The labor force consists of two parts: those (ages 16 and up) who are employed, and those who do not have a job but are available to take a job, and have actively searched for one within the past four weeks. The labor force participation rate is the number of people in the labor force as defined above, divided by the total civilian (non-active military duty) noninstitutional (not in prison or the like) population ages 16 and older.

If you select one or more counties in the dynamic graph below, you can see the share of the population participating in the labor force for every year between 2000 and 2015.

In 2015, Hood River posted the highest labor force participation rate (75.5%) of any county in the state. The next-highest participation rates occurred in the Portland area: Washington County's rate was 67.4 percent, and Multnomah's was 66.0 percent. Hood River, Washington, and Multnomah counties also ranked among the top four counties in terms of labor force participation rates in 2000.

Hood River County's LFPR looked essentially the same in 2000 and 2015, but in most counties labor force participation rates dropped notably over the 15-year period. Multnomah County's participation rate fell by 7 percentage points, and Washington County's declined by nearly 10 points. Just three counties recorded higher labor force participation rates in 2015 than in 2000: Malheur, Sherman, and Wheeler.

Although Oregon has seen a recent slowing and even reversal of the falling labor force participation rate, the state's LFPR declined by almost 8 percentage points from 2000 and 2015. In the long term that declining trend is expected to continue, as the bulk of the Baby Boomers reach retirement age. That's paired with historically low labor force participation rates in younger age groups. More information about Oregon's labor force participation rate can be found in the Employment Department's full report on the topic.

Thursday, April 21, 2016

Semiconductor Manufacturing in Oregon - 2015

Intel recently announced plans to reduce its worldwide workforce by 12,000 jobs, with half of the reduction occurring this year. The company has not said how the layoffs will impact its Oregon facilities, but the announcement brings up a lot of questions about how many and what types of jobs might be affected in Oregon. Intel is part of Oregon’s semiconductor and electronic components manufacturing industry. Although we don’t have information specific to Intel, there is a lot of information about jobs in the overall semiconductor manufacturing industry.

In 2015, there were 148 establishments in Oregon’s semiconductor and electronic components manufacturing industry. The industry employed a total of 29,142 jobs during the year, with a total payroll of more than $4 billion. That was roughly 4.7 percent of all the wages paid in the state last year. The annual average wage is $138,487, which includes bonuses. That’s close to three times the annual average wage for Oregon’s private sector.

A lot of jobs in the semiconductor manufacturing industry are high paying, but not all workers earn close to the industry average. The highest paying occupations tend to be managers, engineers, computer or sales specific occupations. Production occupations, such as semiconductor processors and electrical and electronic equipment assemblers, tend to earn much less.

Nearly three out of four jobs (73%) in the industry were held by men in 2014. Across the overall economy, the share of jobs is more evenly split, with 51 percent of jobs in Oregon held by men.

There are not a lot of younger or older workers in the industry. In 2014, very few jobs in the industry were held by workers under the age of 25 years (3%) or age 65 years and older (2%).

Wednesday, April 20, 2016

Increasing Difficulty Filling Job Vacancies in Oregon

Today, the Oregon Employment Department has released two new sets of job vacancy information.

First, the results are in for the first quarter of 2016. Oregon's private businesses reported 41,300 vacancies this winter. That marks the first time winter vacancies have exceeded 40,000, and reflects rapid job growth in the state.

Health care and social assistance topped all industries with 9,400 vacancies in the winter. Leisure and hospitality (6,600) and retail trade (4,800) also reported large totals. Together these three industries accounted for half of all winter vacancies. Businesses were hiring for diverse types of jobs across the economy though. Seven of 14 major industries reported at least 2,000 job vacancies. Occupations with the most job openings this winter ranged from retail salespersons and cashiers to personal care aides and nursing assistants, cooks, carpenters, maintenance and repair workers, and truck drivers.

Amid accelerated job growth and a large number of vacancies, employers have faced increasing difficulty finding the workers they need. Oregon businesses reported 60 percent of vacancies as difficult to fill this winter, compared with 49 percent one year before.

Once more detailed annual data become available, the Employment Department takes a deeper look at difficult-to-fill job vacancies in the state. Today's second release does just that. The report entitled "Increasing Difficulty Filling Job Vacancies in Oregon's Labor Market" explains the rise of difficult-to-fill job vacancies in Oregon over the past few years. In 2013, businesses reported slightly less than half (48%) of all job vacancies as difficult to fill. That share rose to 51 percent in 2014, and again to 59 percent in 2015.


In particular, businesses report increasing difficulty filling vacancies due to a lack of applicants. Vacancies with a lack of applicants grew from 3,500 in 2013 to 6,700 in 2014 and 9,700 in 2015. Businesses also report a lack of qualified candidates, unfavorable working conditions, and a lack of work experience among the more common challenges filling vacancies.

Much more information about Oregon's job vacancies can be found at QualityInfo.org in the Job Vacancy Survey box on the publications page. If you prefer audio, take a listen to our podcast about these two job vacancy survey releases!


Tuesday, April 19, 2016

March 2016 Employment and Unemployment in Oregon’s Counties

Wheeler County had Oregon’s lowest seasonally adjusted unemployment rate in March at 2.9 percent. Grant County (8.0%) registered the highest rate for the month. Ten of Oregon’s counties had unemployment rates at or below the statewide rate of 4.5 percent and 16 were at or below the national rate of 5.0 percent. Grant, Sherman, and Wheeler counties all saw their unemployment rate improve by 1.8 percentage points over the year, more than any other counties.

Total nonfarm payroll employment rose in all of Oregon’s six broad regions between March 2015 and March 2016. The largest job gains occurred in Central Oregon (+3.9%). Portland (+2.5%), Southern Oregon (+2.4%), the Willamette Valley (+2.2%), Eastern Oregon (+1.7%), and the Oregon Coast (+0.9%) also saw growth.

Monday, April 18, 2016

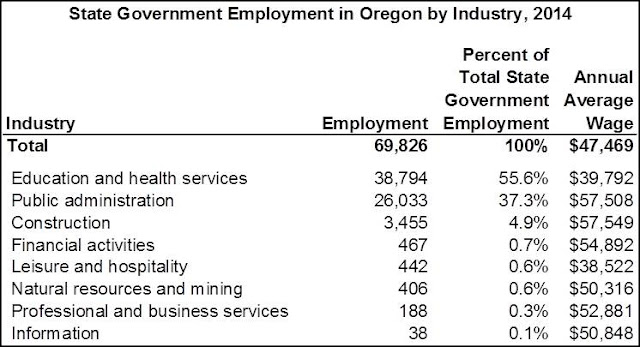
State Government Employment in Oregon

Oregon’s state government sector employed an average of 84,000 in 2014, accounting for slightly less than 5 percent of Oregon’s total nonfarm employment in 2014.

From 1990 to 2014, employment in Oregon’s private sector grew nearly 40 percent. State government as a whole grew about half as fast over that time, growing 21 percent. Within state government, state education employment expanded 31 percent, while the non-education portion of state government grew 16 percent.

Over the long run, local government employment in Oregon has grown at a similar pace to Oregon’s private sector. Local government employment in Oregon added 41 percent from 1990 to 2014.

In 2014, Oregon’s average wage across all ownerships was $46,515. If we subtract all public employment, the average earnings for a private-sector worker was $45,893. The average in state government was $47,469. One reason that state government has a higher average wage than the private sector is that the mix of occupations is significantly different when comparing the private sector and state government.


More than 90 percent of all jobs in state government are in education and health services or in public administration. In the private sector, education and health services comprised roughly 17 percent of total employment.

To learn more about state government employment in Oregon, read Regional Economist Pat O'Connor's article "State Government Employment in Oregon".

Friday, April 15, 2016

Oregon's Over-the-Year Job Growth Among Highest

Oregon gained almost 59,000 jobs between March 2015 and March 2016, growth of 3.3 percent. Only Idaho (3.6%) saw jobs grow more quickly during this period. Utah matched Oregon at 3.3 percent, while Washington and Tennessee followed closely at 3.2 percent.

States that lost jobs over the year included North Dakota (-4.5%) and Wyoming (-3.2%). These states have a large share of jobs in the mining industry, which has lost 185,000 jobs nationally since 2014.


Oregon's growth continued in several of the major industries that have expanded the fastest over the year. Construction gained 4,400, or 5.3 percent, since March 2015, professional and business services added 11,900, and health care and social assistance added 10,100 over the year.

Oregon's Unemployment Rate Down Significantly  

Oregon’s unemployment rate dropped to a record low of 4.5 percent in March—the lowest point since comparable records began in 1976. Oregon’s February unemployment rate was 4.8 percent. A year ago, in March 2015, Oregon’s unemployment rate was 5.7 percent.

With the U.S. unemployment rate at 5.0 percent in March, and Oregon’s unemployment rate at 4.5 percent, this puts Oregon’s rate half a percentage point below the U.S. rate. The last time Oregon’s rate was half a percentage point below the U.S. rate was in November 1995.

Currently, Oregon's unemployment rate is the 23rd lowest in the nation. Oregon has a lower unemployment rate than California (5.4%), Nevada (5.8%), and Washington (5.8%), but a higher unemployment rate than Idaho (3.89).

You can view the unemployment rate for all states in our State Unemployment Ranking Tool.

Tuesday, April 12, 2016

Oregon’s Unemployment Rate Drops to a Record Low of 4.5 Percent in March

Oregon’s unemployment rate dropped to a record low of 4.5 percent in March—the lowest point since comparable records began in 1976. Oregon’s February unemployment rate was 4.8 percent. A year ago, in March 2015, Oregon’s unemployment rate was 5.7 percent.

With the U.S. unemployment rate at 5.0 percent in March, Oregon’s unemployment rate now sits half a percentage point below the nation's. The last time Oregon’s rate was half a percentage point below the U.S. rate was in November 1995.

“Rapid job growth and a historically low unemployment rate mean that Oregon’s labor market is stronger than it’s been in decades,” said state employment economist Nick Beleiciks. “Businesses are raising wages to attract the help they need, and it’s working because people are flocking to Oregon’s labor force.”

Oregon’s payroll employment grew by 3,900 in March, following a revised gain of 7,400. The March gain was close to the average monthly pace seen over the past three years. In March, three major industries each added more than 1,000 jobs: health care and social assistance (+1,400 jobs); wholesale trade (+1,300); and professional and business services (+1,200).

Listen to State Employment Economist Nick Beleiciks discuss this months figures:


Read our detailed analysis here: Oregon Employment Situation.

Monday, April 11, 2016

Oregon's Three Minimum Wages

On March 2, 2016, Senate Bill 1532 was signed into law. As a result, Oregon's minimum wage will increase in steps through 2022. There will be three tiers of step increases, based on geography.

The minimum wage in the Portland urban growth boundary will increase more than the minimum wage in the rest of the state. It is set to increase to $14.75 by 2022. Areas other than those in the Portland tier will increase to $13.50, and nonurban areas will increase to $12.50.

The first increase in minimum wage as a result of SB 1532 will take place on July 1, 2016. This increase will affect nonurban areas differently than the rest of the state. Minimum wage will increase to $9.50 in nonurban areas, while the rest of the state will see minimum wage increase to $9.75.

Beginning in 2023, minimum wage in all tiers will be adjusted for inflation. This means the minimum wage will maintain purchasing power after the last step increase in 2022.


We have received a number of requests for an estimate of the number of jobs affected on July 1, 2016. While this is tricky because we do not know how many jobs, let alone minimum wage jobs, there will be in Oregon on July 1, 2016, we can use past data to make a guess.

Our best way to estimate this is to look at how many jobs paid at or below the new minimum wage level in the second quarter of last year (we choose second quarter – April, May, June – because it is the quarter leading up to July 1). In other words, we count the number of jobs that would have been affected if the minimum wage increase set to happen on July 1, 2016 actually happened in 2015.

In the second quarter of 2015, (i.e., the quarter leading up to July 1), about 203,000 jobs paid at or below the new minimum wage scale. The approximate Portland urban growth boundary had about 83,000 jobs at or below the $9.75 per hour that will take effect on July 1, 2016. About 96,000 jobs were at or below $9.75 in the other areas that will increase to this level. Nonurban areas, which will see minimum wage increase to $9.50 on July 1, 2016, had about 23,000 jobs at or above $9.50 in the three months before July 1, 2015.

It is likely that the minimum wage increase on July 1, 2016 will affect at least as many jobs as we saw at or below the new minimum wage last year. In other words, it is likely there will be at least 203,000 jobs affected by the minimum wage increase on July 1, 2016. Since Oregon's job growth has been strong over the year, there is potential for the number of jobs affected to be greater than 203,000.


Friday, April 8, 2016

Second Quarter 2015: Growth in Jobs and Wages Continues

Wages and jobs continued to grow in the second quarter of 2015, compared with one year earlier. The number of jobs grew by more than 71,000, or 3.7 percent. Real median wages increased overall by $0.23 per hour, or 1.3 percent. All broad industries and all firm size classes added jobs. Construction was the only industry that did not see an increase in its median wage.

Leisure and hospitality, natural resources, and manufacturing all lost a significant number of jobs during the Great Recession. Since then, with the exception of manufacturing, the number of jobs lost by these industries has been recovered. They had the highest rates of over-the-year job growth through the most recent quarter. Leisure and hospitality jobs increased by 5.8 percent, natural resources jobs by 5.5 percent, and manufacturing jobs by 4.7 percent.


Construction is another industry that lost many jobs during the recession. Like manufacturing, it has yet to regain them all, needing nearly 26,000 additional jobs to return to its pre-recession second quarter employment. During the recent year-over-year period, construction added only 104 jobs, for a meager growth rate of 0.1 percent. Financial activities fared little better than construction, adding only 206, or 0.2 percent more jobs.

The median hourly wages of the top four job growth industries also kept ahead of inflation (which was near zero between 2014 and 2015). Of the four, the median wage for natural resources and mining grew the most (+3.7%) and the wage for leisure and hospitality nearly matched that (+3.3%). The increase in the minimum wage, from $9.10 to $9.25 per hour in 2015, may explain in large part the rise in the median wages of these two low-wage industries. Information and financial activities, both of which have a high median hourly wage, were the two top wage growth industries, with increases of 4.5 percent and 4.2 percent, respectively. Construction was the only industry that saw its median wage drop – by $0.40 per hour, for a loss of 1.7 percent.

For more information on the number of jobs and wages by firm size class, read "Second Quarter 2015: Growth in Jobs and Wages Continues" by Regional Economist Erik Knoder and Special Projects Analyst Barbara E. Peniston.

Wednesday, April 6, 2016

Consumer Price Index for Shelter on the Rise in Portland-Salem MSA

The Consumer Price Index for All Urban Consumers in the Portland-Salem area grew 1.1 percent between the second half of 2014 and the second half of 2015, faster than the U.S. increase of 0.3 percent. These low levels of inflation have been driven by decreases in gas and oil prices. The U.S. saw a drop of 24.6 percent in gas and oil prices over the year, while Portland-Salem area saw a drop of 24.2 percent.

The Consumer Price Index for shelter had a higher increase (6.0%) in the Portland-Salem area than the U.S. city average (3.2%). Shelter is about one-third of the CPI - All Items, which helped push Portland's CPI above the U.S.

In contrast, the Portland-Salem area had little change in prices for food. The over-the-year growth rate fell from 3.6 percent in the first half of 2015 to 0.7 percent in the second half of 2015. The over-the-year growth rate for the U.S. city average had a relatively moderate decline from 2.3 percent in the first half of 2015 to 1.4 percent in the second half of 2015.

Monday, April 4, 2016

Where Women Work and How Much They Earn

More than 820,000 jobs at Oregon businesses and state and local governments were held by women in 2014. Women represent 49 percent of employment in Oregon, but the share of jobs held by women varies considerably by industry.

Women’s average earnings were $3,217 per month in 2014, which was 68 percent of the $4,712 average monthly earnings of men. The average woman brings home nearly $1,500 a month less than the average man. Like employment, the earnings of women relative to men varies by industry.

The average monthly paycheck for women is about two-thirds the average monthly paycheck for men, but this fact is not a very useful measure of gender pay inequality. Average monthly earnings figures do not take into account other factors affecting pay, such as total hours worked and hourly wages. Adjusting for the number of hours worked narrows the earnings gap between women and men, but still does not account for other factors that can significantly affect pay.

Women working in Oregon’s health care and social assistance sector have an average monthly paycheck of $3,453, which is just 61 percent of the men’s average. Women working in finance and insurance have a higher average paycheck than women in most other industries, but their earnings pale in comparison to what men are bringing in. With earnings just 55 percent of men’s, women in finance and insurance receive an average of nearly $3,800 a month less than what men are making.

To learn more about women's average earnings by industry, read State Employment Economist Nick Beleiciks' article "Where Women Work and How Much They Earn".