From 1990 to 2014, employment in Oregon’s private sector grew nearly 40 percent. State government as a whole grew about half as fast over that time, growing 21 percent. Within state government, state education employment expanded 31 percent, while the non-education portion of state government grew 16 percent.
Over the long run, local government employment in Oregon has grown at a similar pace to Oregon’s private sector. Local government employment in Oregon added 41 percent from 1990 to 2014.
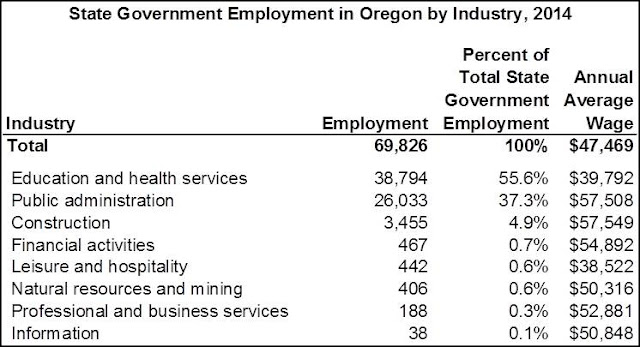
In 2014, Oregon’s average wage across all ownerships was $46,515. If we subtract all public employment, the average earnings for a private-sector worker was $45,893. The average in state government was $47,469. One reason that state government has a higher average wage than the private sector is that the mix of occupations is significantly different when comparing the private sector and state government.
More than 90 percent of all jobs in state government are in education and health services or in public administration. In the private sector, education and health services comprised roughly 17 percent of total employment.
To learn more about state government employment in Oregon, read Regional Economist Pat O'Connor's article "State Government Employment in Oregon".

No comments:
Post a Comment