Pages

Showing posts sorted by date for query migration. Sort by relevance Show all posts

Monday, April 26, 2021

Why Oregon's Labor Market is Tighter Than You Think

We've been hearing more in recent days about employers' challenges finding workers. Over the past week, we've teamed up with the Office of Economic Analysis to publish a summary of reasons Oregon's labor market is tighter than you might think.

The pandemic recession -- just like all economic downturns -- is unique. During this recovery labor demand remains strong. At the same time, several simultaneous factors are constraining the supply of labor for those job openings. They include:

1. Concentrated Nature of the Shock
Last spring, many businesses with similar labor pools shut down overnight. The economy experienced record-setting job losses and the unemployment rate increased nearly 10 percentage points in April 2020 alone. Those who remain unemployed are also largely on temporary layoff. In the previous recessions, the job losses were largely permanent, and the economic nadir did not occur until more than two years into each cycle, so businesses hiring during the recession and recovery had excess labor supply for a while. During this recovery the jobless numbers have dropped much faster.

Oregon’s unemployment rate matched the nation’s at 6.0% in March, below the average of 6.8% over the past two decades. Currently, hiring employers are facing a typical or slightly lower-than-typical available labor pool for their job openings. The available labor force is not evenly distributed either. While all sectors lost jobs in the initial COVID downturn, some have bounced back rapidly or hit new employment highs (such as transportation, warehousing and utilities, and professional and technical services). Depending upon the types of jobs employers are hiring for, there may be no excess labor. 

2. Pandemic Concerns
The unemployment rate doesn’t include would-be workers who are out of the labor force, meaning they neither have a job, nor are they looking for one. Supplemental information from households in the Current Population Survey shows an estimated 45,000 people in Oregon said they were prevented from looking for work due to COVID-related reasons during the first quarter of 2021. While vaccinations have accelerated, only about half the adult population has received at least one vaccine dose for COVID-19 as of mid-April. COVID case counts are also rising in many areas of Oregon again this spring.

3. Lack of In-Person Schooling
Heading into the pandemic, one out of every six Oregonians in the labor force had kids, worked in an occupation that cannot be done remotely, and also did not have another non-working adult present in the household, according to research from the Office of Economic Analysis. As of mid-April, three-fourths of Oregon’s K-12 schools have students learning remotely from home either part- or full-time, according to Oregon Department of Education records.

Even with the anticipated return of full-time, in-person learning for the 2021-2022 school year, child care slots, which were already too scarce in most areas of the state prior to the pandemic, and summer programs will likely continue operating with reduced capacity for some time. These constraints limit workforce options for some parents of younger children.

4. Federal Aid and Unemployment Benefits
Total personal income in Oregon today is about 15% higher than before the pandemic. Strong federal fiscal policy response via recovery rebates alone added $12 billion to personal income in Oregon. Although this has brightened the overall economic outlook, a stronger safety net where incomes are higher today than pre-COVID can temporarily reduce labor force participation in the short term for some workers. 

Federal Pandemic Unemployment Compensation (FPUC) adds $300 onto weekly unemployment insurance benefits through September 4, 2021. In the first quarter of 2021, the weekly regular unemployment (UI) benefit has averaged $370 per week. With the additional $300 FPUC payment, that adds up to an average payment of $670 per week. That’s roughly the same as earning $16.75 per hour for someone working full time. During the first quarter of 2021, that has also represented full wage replacement (between 100% and 104%) relative to regular UI claimants’ pre-pandemic earnings on the job. 

Some perspective here: earning $670 per week, working year round would total $34,800 in gross earnings for a worker. By comparison, the median earnings for full-time workers in Oregon in 2019 was $50,712. With “Now Hiring” signs in many business windows and stronger wage offerings as employers compete for available workers, it’s unlikely that this benefit, in itself, is keeping a vast number of workers on the sidelines.

Furthermore, unemployed workers cannot refuse job offers or a recall to their previous job (if temporarily laid off) because of their unemployment benefit amount. Refusing work solely due to weekly unemployment benefit payments would be considered fraud. The Employment Department provides ways to report job refusals.

Last but not least, Oregon has a long-running record of adding labor force through net in-migration of workers from other states and areas. While Oregon continued to attract migrants in 2020, net migration fell to its lowest level since 2013 in Oregon, and was 20% lower at 28,600 than in 2019.  

More information on Oregon's current labor market dynamics can be found in the full article and OEA blog post, written by State Economist Josh Lehner and State Employment Economist Gail Krumenauer.

Wednesday, April 21, 2021

Oregon’s 2020 Natural Population Increase Was the Lowest on Record

In 2020, Oregon’s population increased by 31,655 to 4,268,055. This marked growth of 0.7% over the year and growth of 11.4% since the 2010 Census. Portland State University’s Population Research Center recently released more detailed information on why this population growth has occurred.

Two things lead to population change. First, an area increases in population if more births than deaths occur in a given year. Second, population can increase or decrease through net migration. That is, over the year, people either move into or out of an area. A positive value of net migration means more people moving into an area than leaving it, while a negative value of net migration indicates more people leaving an area than moving in.

In 2020, 90% of Oregon's population increase was due to net migration. Natural increase contributed just 3,100 to population growth, which was the lowest since comparable records began in 1960. The low natural increase is caused by an increase in the number of deaths (37,800), which was the highest total since 1960. In 2018 and 2019, there were 36,600 deaths in Oregon each year. Since 2011, Oregon had a relatively low natural increase compared with the prior four decades.


While Oregon continued to attract migrants in 2020, net migration was 20% lower at 28,600 than it was in 2019. The number of net migrants has been dropping steadily over the past few years since 2017, likely driven by a slower growing economy towards the end of the last economic expansion and housing availability and affordability. The current economic crisis driven by public health restrictions related to the COVID-19 pandemic contributed to continued declines in net migration in 2020.

To learn more, read Economist Sarah Cunningham's full article here

Friday, January 17, 2020

Oregon Ranks 10th in Rate of In-Migration from 2018 to 2019


On December 30, 2019, the U.S. Census Bureau released state population change estimates from July 1, 2018 to July 1, 2019. Oregon ranked 10th in rate of net in-migration. 

Here is how Oregon ranked in other published categories: 

27th in population as of July 1, 2019  (4,217,737)
15th in population growth since 2018 (35,851)
13th in population growth rate since 2018 (0.9%)
11th net in-migration since 2018 (29,116)
10th in net in-migration rate per 1,000 people since 2018 (6.9%)
31st in natural increase since 2018 (6,742)
37th in natural increase rate per 1,000 people since 2018 (1.6%)

To learn more, view the detailed population tables here

Wednesday, December 4, 2019

Oregon Construction Employment at Record Highs

Oregon’s construction industry reached a record high number of jobs in recent months, employing an average of 108,000 during the 12 months ending with October 2019. The industry added jobs steadily and rapidly in recent years, following a prolonged slump in 2009 through 2012, when employment remained near 70,000 for several years after the last recession.

Looking back 30 years, clearly the industry has been highly cyclical – experiencing booms and busts over the course of multi-year expansions that were followed by briefer, but potentially precipitous contractions.
In the late 1990s, the industry hovered close to 80,000 jobs for several years, dropped some jobs in a mild recession and then resumed its climb. Just before the 2008 recession, Oregon’s construction industry was slightly below today’s employment total, at about 104,000 jobs.

During the past several decades, at least since the late 1980s, Oregon’s economy and population have been on a generally expansionary trend. Population typically grew about 1 percent per year, primarily due to net in-migration – more people moving into Oregon compared with the number moving out.

Because the population has been steadily expanding, it can be helpful to look at the construction industry’s total jobs relative to overall employment. Over the past 30 years, construction has employed between 4 percent and 6 percent of Oregon’s total nonfarm payroll employment. The lowest share during this period occurred in 1992, when 4 percent were employed in construction. Not far behind was the period from 2010 through 2012 when about 4.2 percent of payroll jobs were found in construction.

The housing-price boom leading up to the last recession coincided with the biggest share of construction jobs, as construction employed 6 percent of all nonfarm payroll jobs during much of 2006 and 2007. Currently, Oregon’s construction industry isn’t quite as concentrated as that period, with 5.5 percent of nonfarm jobs in the industry as of October of this year. This is moderately above the 4.9 percent average over the past 30 years.

Leading up to the past two national recessions, Oregon’s construction employment has either trended downward, as was the case in 1997 through 2000, or abruptly tanked, as occurred just prior to, and certainly during, the recession of 2008 and 2009. Over the past 12 months, the industry has stalled at a high level of employment, following rapid growth over the past several years.

One of the reasons that the current economic expansion – both in Oregon and at the national level – has been so long and persistent is due to the pattern of housing starts. In the several years immediately following the last recession, building permits and housing starts were very low by historic standards. The low level of residential construction activity and spending was a limiting factor for economic growth, given that new-home building is a major component of change in the overall dollar value of economic activity for a region. In Oregon, residential building permits (single-family and multi-family combined) stagnated near an average monthly rate of 600 during 2009 through 2011, but have since climbed to the current rate of 1,700 per month. Despite the near-tripling of monthly housing permits in the time span, we’re still well below peak levels seen during several periods during the 1990s and mid-2000s, not to mention the house-building boom in the late 1970s, when building permit activity was double the current level.

Construction activity includes more than just building homes and apartments. There is road construction and commercial construction, as well as remodeling and other forms of construction employment. This brief article looked at the trends over time in residential building permits, as they are a key measurement that is readily available to assess Oregon’s construction industry.

Overall, Oregon’s construction employment trends indicate that we are currently experiencing booming times in the industry. Oregon has gone through several cycles in the construction industry over the past several decades. Our current situation, while near a record high in terms of overall construction jobs, is not running at as frenzied a pace as has been seen in the past, at least when measured relative to the state’s ever-growing population.

Read Current Employment Statistics Coordinator David Cooke's full article here.

Wednesday, August 7, 2019

Oregon Employment Forecast: Growth Ongoing, But Slowing

The U.S. economic expansion turned 10 years old this summer, making it the longest expansion in recorded history. Oregon’s expansion also continues, although our job growth is no longer handily outpacing the nation as had been the case for most of the past six years. Not to worry, as growth remains strong enough to keep up with population gains and hold the unemployment rate down at record lows.

Early this year, the word ‘recession’ began creeping back into forecasters’ lexicon when they discussed the U.S. economic outlook. Soft data in the form of a December stock market correction and weakness in retail sales, housing, and manufacturing, combined with the government shutdown and policy concerns, had raised fears that the economy was on the cusp of another recession. But most indicators revived in the spring, consumer spending remains strong, and incomes are rising. The economy is back on firmer ground and talk of an imminent recession has somewhat subsided.That said, the outlook calls for slowing growth this year and next, both nationally and locally. In Oregon, forecasters from the Office of Economic Analysis (OEA) expect the state will add 39,800 jobs (+2.1%) this year before slowing further in 2020 (32,100 jobs; 1.6%).


Growth will be constrained in part by our tight labor market. Unemployment has been near record lows for nearly three years, and the share of prime working-age Oregonians with a job is back to where it was right before the Great Recession. In other words, most workers who lost their jobs during the recession are now employed, and many who had been sitting on the sidelines have been pulled back into the labor force. So employers must rely even more than usual on their other source of potential employees: people moving into the state. However, migration slowed in 2018 and will likely remain below peak levels (2016-2017) for the foreseeable future, thus limiting job growth.

Find more details in Regional Economist Amy Vander Vliet's full article here.

Thursday, May 16, 2019

Migration Patterns in the Past Five Years

Oregon is an in-migration state. For many years, more people have moved into Oregon each year than have moved out of the state. This population growth fuels the expansion of our cities and brings new brain power to foster the economic engine of Oregon’s future. Workers in some occupational groups are more likely to move than others. Where do these in-migrants come from? And when Oregonians leave, where do they go?

The largest occupational groups also have the largest net in-migration numbers. The top 10 occupational groups by net in-migration include the top nine groups by total employment size in Oregon. These occupations employ a lot of workers, so it isn’t surprising that many of the people moving to Oregon are working in these types of jobs. Smaller occupation groups tend to have lower levels of net in-migration.

Across occupation groups, net in-migration numbers typically account for between 1 percent and 4 percent of the groups’ estimated 2013 to 2017 labor force. At the low end, with net in-migration averaging about 1 percent of total employment, are occupations like protective service; construction and extraction; and installation, maintenance, and repair. Occupations with a more sizeable net in-migration impact averaging about 4 percent of statewide employment include food preparation and serving; and arts, design, entertainment, sports, and media.
To learn more about migration patterns in Oregon, read the article written by Employment Economist Jessica Nelson.  

Thursday, May 2, 2019

Oregon’s 2018 Natural Population Increase Was the Lowest on Record

In 2018, Oregon’s population increased by 54,200 to 4,195,300. This marked growth of 1.3 percent over the year, and growth of 9.5 percent since the 2010 Census. Portland State University’s Population Research Center recently released more detailed information on why this population growth has occurred.

There are two main reasons that lead to population change. First, an area increases in population if more births than deaths occur in a given year or vice versa. Second, population can increase or decrease through net migration. That is, over the year, people either move into or out of an area. A positive value of net migration means more people moving into an area than leaving it, while a negative value of net migration indicates more people leaving an area than moving in.

In 2018, natural increase contributed 6,600 to population growth, which was the lowest since comparable records began in 1960. The low natural increase is caused by an increase in the number of deaths (36,200), which was the second highest total since 1960 after 2017. In 2017, there were 36,800 deaths in Oregon. Since 2011, Oregon had a relatively low natural increase compared with the prior four decades. A lot of Oregon’s population increase in 2018 was due to net migration, which at 47,600 people was one of the largest net migrations since 1996.
To learn more about Oregon's population change, read the article by projections economist Felicia Bechtoldt

Friday, September 21, 2018

Oregon Construction Employment at Record Highs

Oregon’s construction industry reached a record high number of jobs in recent months, employing nearly 110,000 on a seasonally adjusted basis. The industry added jobs steadily and rapidly in recent years, following a prolonged slump in 2009 through 2012, when employment remained near 70,000 for several years after the last recession.

Looking back 30 years, clearly the industry has been highly cyclical – experiencing booms and busts over the course of multi-year expansions that were followed by briefer, but potentially precipitous contractions. In the late 1990s the industry hovered close to 80,000 jobs for several years, dropped some jobs in a mild recession and then resumed its climb. Just before the 2008 recession, Oregon’s construction industry was slightly below today’s employment total, at about 104,000 jobs.

During the past several decades, at least since the late 1980s, Oregon’s economy and population have been on a generally expansionary trend. Population typically grew about 1 percent per year, primarily due to net in-migration – more people moving into Oregon compared with the number moving out.

Because the population has been steadily expanding, it can be helpful to look at the construction industry’s total jobs relative to overall employment. This tells us the percent of total nonfarm jobs employed by the industry. Over the past 30 years, construction has employed between 4 percent and 6 percent of Oregon’s total nonfarm payroll employment. The lowest share during this period occurred in 1992, when 4 percent were employed in construction. Not far behind was the period from 2010 through 2012 when about 4.2 percent of payroll jobs were found in construction.

The housing-price boom leading up to the last recession coincided with the biggest share of construction jobs, as construction employed 6 percent of all nonfarm payroll jobs during much of 2006 and 2007. Currently, Oregon’s construction industry isn’t quite as concentrated as that period, with 5.7 percent of nonfarm jobs in the industry as of July of this year.

Leading up to the past two national recessions, Oregon’s construction employment has either trended downward, as was the case in 1997 through 2000, or abruptly tanked, as occurred just prior to, and certainly during, the recession of 2008 and 2009. The good news is that construction employment in Oregon has grown quite rapidly over the past few years and hasn’t shown any sign of downturn yet.
Learn more about employment in Oregon's construction industry, read the full article written by the Current Employment Statistics Coordinator David Cooke. 

Thursday, May 3, 2018

Oregon’s 2017 Natural Population Increase Was the Lowest on Record

In 2017, Oregon’s population increased by 64,750 to 4,141,100. This marked growth of 1.6 percent over the year, and growth of 8.1 percent since the 2010 Census. There are two main reasons that lead to population change. First, an area increases in population if more births than deaths occur in a given year or vice versa. Second, population can increase or decrease through net migration. That is, over the year, people either move into or out of an area. A positive value of net migration means more people moving into an area than leaving it, while a negative value of net migration indicates more people leaving an area than moving in.

In 2017, natural increase contributed 7,900 to population growth, which was the lowest since comparable records began in 1960. The low natural increase is caused by an increase of the number of deaths (36,800), which was the highest since 1960. Since 2011, Oregon had a relatively low natural increase relative to the prior four decades.

Oregon Continues to Attract Migrants

A lot of Oregon’s population increase in 2017 was due to net migration, which at 56,800 people was the largest net migration since 1991.

Over the past 20 years, Oregon had an average net migration of 27,800 people per year. The lowest number of net migrants over the last 20 years was 7,000 in 2010. In general, we see net migrants increase as the economy expands and more jobs become available. Notice that prior to the Great Recession, net migration was booming in Oregon. As the recession hit, people became less mobile. This, combined with Oregon experiencing a deeper recession than the nation as a whole, brought net migration to its lowest levels since the 1980s.

To learn about population growth in metro areas, read Economist Felicia Bechtoldt's full article.

Thursday, September 14, 2017

Building Permits in Oregon

Oregon’s population continues to grow, led by migration to the state. Housing availability for both buyers and renters has become a concern in many local areas.

Oregon’s population added more than 600,000 residents between 2001 and 2016, averaging 1.1 percent growth per year during that time. The growth has not been evenly distributed across the state. Metropolitan areas in Oregon are growing more quickly than rural Oregon. Metro areas gained 561,000 residents between 2001 and 2016, averaging 1.1 percent growth per year, while rural areas gained 43,000 and averaged 0.4 percent growth per year.

Residential building permits in Oregon averaged around 17,600 per year between 2001 and 2016, according to a U.S. Housing and Urban Development Department (HUD) database titled the State of the Cities Data Systems (SOCDS). The number of building permits statewide peaked at more than 30,000 in 2005, fell below 10,000 in 2009 through 2011, and has returned to more than 19,000 in 2016.

The Portland Metro area accounted for about 60 percent of statewide permits in the last few years. From 2010 through 2016, metro areas have seen residential permits grow to 5.3 permits per 1,000. Rural area permits have edged up, but they started their recovery later and have grown slower than in metro areas, reaching 1.9 permits per 1,000 in 2016.
Learn more about the types of building permits in the full article written by Will Summers and Jessica Nelson.

Friday, June 9, 2017

Demographic Challenges for Rural Oregon's Workforce

The Oregon Employment Department recently released a special report entitled The Employment Landscape of Rural Oregon. Our examination of rural Oregon’s employment landscape shows a variety of factors have led to a slower recovery outside metropolitan areas. Demographic trends are among the most striking. Natural population growth is low, in-migration is slow, and young people often leave rural communities to seek educational or employment opportunities in urban centers.

Oregon’s rural communities are growing, just at a much slower pace than in urban centers. Net population change results from the combination of two factors: natural increase or decrease in a population (births minus deaths); and net migration (in-migrants minus out-migrants). In-migration – new residents moving in – accounts for all of the population growth in rural Oregon between 2010 and 2016. Oregon’s 23 rural counties combined actually had a natural decrease, with 400 more deaths than births among residents. In metro counties, natural increase accounted for 33 percent of population gains between 2010 and 2016.

A lack of natural increase alone wouldn’t be troubling for the workforce pipeline in rural areas, so long as in-migration included working adults and children. Between 1995 and 2015, that does not appear to be the trend though. There are more than 35,000 additional workers ages 55 and older in rural Oregon today, an increase of 135 percent. Meanwhile, the rural prime working age and youth workforces are both smaller today than back in 1995.

Rural Oregon is in need of its next generation of leaders and could benefit from finding ways to alleviate the tendency toward aging that is a major challenge in many nonmetro areas. Read more about demographics and the workforce in rural Oregon in the full article at QualityInfo.org.

Oregon’s 2016 Net Migration Was the Highest Since 1993

In 2016, Oregon’s population increased by 62,500 to 4,076,400. This marked growth of 1.6 percent over the year, and growth of 6.4 percent since the 2010 Census.

There are two main causes of population change. First, population can increase or decrease through net migration. That is, over the year, people either move into or out of an area. A positive value of net migration means more people moving into an area than leaving it, while a negative value of net migration indicates more people leaving an area than moving in. Second, an area increases in population if more births than deaths occur in a given year and decreases if births are outnumbered by deaths.

A lot of Oregon’s population increase was due to net migration, which at 52,100 people was the largest net migration since 1993. Over the past 20 years, Oregon had an average net migration of 27,100 people per year. The lowest number of net migrants over the last 20 years was 7,000 in 2010. In general, we see net migrants increase as the economy expands and more jobs become available. Notice that prior to the Great Recession, net migration was booming in Oregon. As the recession hit, people became less mobile. This, combined with Oregon experiencing a deeper recession than the nation as a whole, brought net migration to its lowest levels since the 1980s.

Natural increases contributed 10,400 to population growth in 2016, which was slightly higher than the previous year, when the natural increase was 10,300. Over the last two years, Oregon had a relatively low natural increase compared with the last three decades. The last time Oregon had a similar natural increase was in 1973, when the natural increase was 10,500.


Learn more about population in metro areas in the full article "Oregon’s 2016 Net Migration Was the Highest Since 1993" written by Economist Felicia Bechtoldt.

Monday, February 6, 2017

Oregon Employment Forecast: Down Shifting from Full Throttle

Oregon’s economic expansion endures, albeit it at more subdued pace. This doesn’t come as a surprise, as the red hot job growth of recent years was unsustainable over the long run. Monthly growth decelerated from an average of about 5,000 jobs in 2015 to 3,000 in the final quarters of 2016 as Oregon’s economy approached full employment and felt the effects of a strong U.S. dollar and weak global economy, weighing down our export-dependent manufacturing sector.

The outlook calls for continued expansion with above average gains compared with the rest of the nation, but at a more moderate pace than in recent years according to the latest Oregon Economic and Revenue Forecast from the Oregon Office of Economic Analysis (OEA). They anticipate growth to slow from the full-throttle rates of 3 percent to 3.5 percent to about 2.5 percent this year, or roughly 3,500 jobs per month. OEA points out that these gains are still strong enough to accommodate anticipated population growth and hold down the jobless rate.


Growth will be dominated by service-sector industries such as the large and diverse professional and business services (e.g., company headquarters, temp help, computer systems design); leisure and hospitality (e.g., restaurants, golf courses); and private health care. These three sectors will account for nearly two-thirds of net new jobs.

Goods-producing industries, whose growth outpaced the overall economy since 2013, are expected to play a smaller role going forward. Notably manufacturing, which downshifted into neutral last year following six years of gains totaling 27,000 jobs. OEA points to a weak global economy, the strong dollar, and the cyclical nature of manufacturing as reasons behind the flat forecast. Construction will also slow, but still add thousands of jobs as the housing rebound continues, driven by new household formation and in-migration. OEA estimates that new home construction lags demand by about a year. Overall, 2017 will end up 2.4 percent over 2016 (43,400 jobs) with a similar pace forecasted for 2018. 

Tuesday, December 6, 2016

Challenges Facing Rural Oregon

More than 83 percent of Oregon’s population is concentrated in the state’s eight metropolitan statistical areas. Rural cities and towns stand as islands of development surrounded by a sea of forest, farms, and rangeland. This distinct urban/ rural divide is in a large part due to Oregon’s strict land use planning laws, which encourage density in urban settings over suburban sprawl into rural communities. Oregon’s rapid job growth has received significant attention as employment growth ranked second fastest in the United States over the past year. Much of the current economic expansion is being driven by job growth in the state’s major urban centers, while rural Oregon continues its long and slow recovery from the devastating recession. Why is the pace of recovery so much slower in rural Oregon? What economic challenges do rural Oregonians face?

An Uneven Recovery

Oregon has been in a period of economic expansion since October of 2014 when total nonfarm employment levels exceeded the pre-recession peak. It was a long recession and slow recovery, taking six and a half years to add back all the lost jobs. However, in rural Oregon the recovery is ongoing. Today, employment levels remain 3.2 percent below the pre-recession peak in rural counties, while employment levels in urban counties are 6.6 percent above the pre-recession peak. In order to recover from the recession, rural counties would need to add nearly 8,000 additional jobs, which would take another year and a half at the current pace of job growth.

Demographics

One of the largest challenges faced by rural economies is the overwhelming demographic trends that are leading to rapid aging in these communities. Natural population growth is low, in-migration is slow, and young people often leave rural communities to seek educational or employment opportunities in urban centers.

Oregon’s rural communities are growing, just at a much slower pace than in urban centers. According to Portland State University, rural counties added nearly 13,000 new residents between 2010 and 2015 (+1.9%), whereas urban counties expanded by 4.9 percent over the same period.

To learn more about the economic recovery, demographics, infrastructure and industry composition in rural Oregon, read the full article "Challenges Facing Rural Oregon" by Regional Economist Damon Runberg.

Tuesday, June 28, 2016

Oregon Continues to Attract Migrants

In 2015, Oregon’s population increased by 51,100, surpassing the mark of 4 million residents. This marked growth of 1.3 percent over the year. A lot of Oregon’s population increase was due to net migration, which at 40,600 people was the largest net migration since 2006. Natural increases contributed 10,500 to population growth, which may be the smallest natural increase since 1973.

A positive value of net migration means more people moving into an area than leaving it, while a negative value of net migration indicates more people leaving an area than moving in. An area naturally increases in population if more births than deaths occur in a given year.


From 2010 to 2015, Oregon’s net migration gain was 120,000, which made up about 65 percent of the population gain. The net migration gain in metro areas of the state was 105,100, which accounted for 88 percent of total net migration gains in the state. Since 83 percent of Oregonians live in a metro area, this gain suggests the share of Oregonians living in metro areas is increasing slightly.


While metro areas in Oregon grew 5.3 percent between 2010 and 2015, rural areas grew only 2.2 percent. In some cases, counties saw a decline in population. Declines can occur due to losses in both natural growth and net migration, or one of the two factors outweighing the other.

To learn more about the counties experiencing population declines, read Employment Economist Felicia Bechtoldt's article "Oregon’s 2015 In-Migration Was the Highest Since 2006".

Wednesday, March 16, 2016

Oregon's Labor Force Largest Ever

Oregon’s labor force has grown rapidly. During the past two years, Oregon’s labor force grew by nearly 100,000 individuals to reach an all-time high of 2,018,000 in February 2016. Key factors boosting the labor force include rapid job growth, in-migration, and growth in new entrants to the labor force.
In addition to a record labor force in Oregon, Oregon's unemployment rate (4.8%) is at it's lowest level in more than 20 years. It's down from last year's February figure of 5.8%. The number of employed workers over the year has increased (+86,000), while the number of unemployed workers has decreased (-16,000).

For more information on Oregon's labor force, visit the Oregon Local Area Unemployment Statistics.

Wednesday, December 3, 2014

Net Migration Accounts for Most of Oregon's Population Growth

Population growth is split into two major categories: natural increase and net migration. Natural increase is simply the number of births in an area minus the number of deaths. Net migration is the the number of people who move into an area minus those who move out.

Portland State University's Population Research Center estimates these numbers for Oregon, and recently released their preliminary estimates and summary for 2014.

A few highlights from the preliminary estimates:
  • Oregon's population increased by 43,545 (+1.1%) to 3,962,565
  • 74% of Oregon's population growth between 2013 and 2014 occurred due to net in-migration, while 26% came from natural increase
  • Net in-flow of movers has increased for the fourth straight year


Wednesday, September 24, 2014

Just in Time for Fall: New. new and more new articles!

Good Morning! Are you ready for fall? Are you ready for new articles on QualityInfo.org? Hope your answer is yes, because along with autumn’s arrival, we have nine great articles for your edification and enjoyment.

“54’40 Or Fight” and “Oregon, We Love Dreamers” are both public relations slogans, although one is considerably older than the other. In Advertising and Public Relations – the Mad Men of Oregon? Brian Rooney shares some history and economic trends about this interesting industry. “Try it, you’ll like it!”

How can Oregon’s unemployment rate go up while we add almost 3,000 to the employment roles in August? Good question! David Cooke has the answers to this and more in Oregon Added Jobs in August While the Unemployment Rate Edged Up.

Do you want a job that pays well and is likely in high demand? Brenda Turner has just the information you need in 10-Year Occupational Projections for STEM Jobs. Hint – you should be interested in Science, Technology, Engineering, and Mathematics.

Yes, we just passed the autumnal equinox, but the holiday season is only nine weeks away. Just in time, Nick Beleiciks is Unwrapping Holiday Hiring. Consider it an early present from us to you.

Do younger workers change jobs more frequently than older workers? What is our turnover rate? Read Older Worker Turnover Remains Low During Recovery by Jessica Nelson for answers to these questions and more.

Are people moving in or out of Oregon? Where are they moving here from? Where are Oregonians moving to? What occupations account for a large percentage of in-migration? The prolific Jessica Nelson has some answers that might surprise you in Migration Patterns in the Past Five Years.

What is Oregon’s Office of Economic Analysis prognosticating for our economy? Read Amy Vander Vliet’s excellent synopsis Oregon Employment Forecast: Not Only Intact, but Accelerating to find out.

One popular quote from our third President is “A little rebellion now and then is a good thing.” Proponents of a 51st state have named it after this President. Guy Tauer gives us the facts and figures about what the economy in this state might look like in State of Jefferson: An Economic Perspective.

Deschutes County was one of the hardest hit counties in the Great Recession. Times have changed. Long Awaited Recovery Kicking Into Overdrive in Deschutes County, by Damon Runberg tells the story.

Our goal is that the information found in these articles and elsewhere on our main page, www.QualityInfo.org, is useful in your work and business life. You might know that a redesigned QualityInfo.org is coming on November 3rd. We are excited and hope you will be as well.

Enjoy Oregon’s beautiful fall colors, especially the return of the GREEN now that the rain is back.

Monday, June 16, 2014

In-Migration Makes Up Two-Thirds of Oregon's 2013 Population Growth

In 2013, Oregon’s population increased by 35,285 people to total almost four million. During the past 10 years, the population has grown 10.8 percent. Portland State University’s Population Research Center recently released more detailed information on why this population growth has occurred. 

Two main factors comprise population change. First, population can increase or decrease through net migration. That is, over the year, people either move into or out of the area in question. The second factor is natural increase or decrease. An area naturally increases in population if more births than deaths occur in a given year.

Following a dramatic decline in gains from migration during the recessionary years of 2007 to 2009, an increasing number of people have moved to Oregon during the past three years. Net migration increased from 14,027 in 2012 to 23,280 (+66%) in 2013. While net in-migration increased, natural increase stayed roughly the same, at about 12,000. This means net migration gains made up about two-thirds of Oregon’s 2013 population growth. The combination of natural increase and net in-migration (+35,300) led to the largest increase in population since 2008.

For more information on Oregon's population change, read the full article here: In-Migration Makes Up Two-Thirds of Oregon's 2013 Population Growth.

Wednesday, May 22, 2013

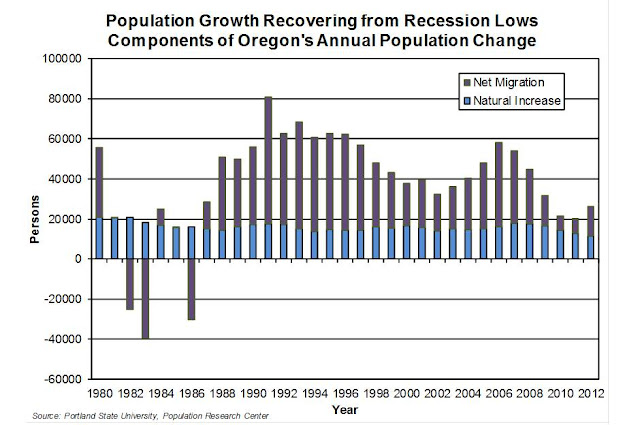
Net Migration Tends to Drive Oregon's Population

Based on estimates from the Population Research Center at Portland State University, net migration fueled Oregon's population growth in 2012. Between July 1, 2011 and July 1, 2012 Oregon's population added 26,110, of which net migration accounted for 14,548.
Net migration typically leads Oregon's annual population change, while the natural increase -- the net result of births and deaths -- is a relatively smaller and more stable component of population change.  However, beginning in 2009, natural increases took the lead by becoming a larger share of Oregon's population change, as net in-migration dropped. Annual net in-migration tapered off through the Great Recession and sluggish recovery. It slid from 36,100 additional residents in 2007 to just 7,000 in 2010, the lowest level since 1987.

For more information about Oregon's population change, including population information on Oregon's counties, check out the full article written by State Employment Economist Nick Beleiciks.