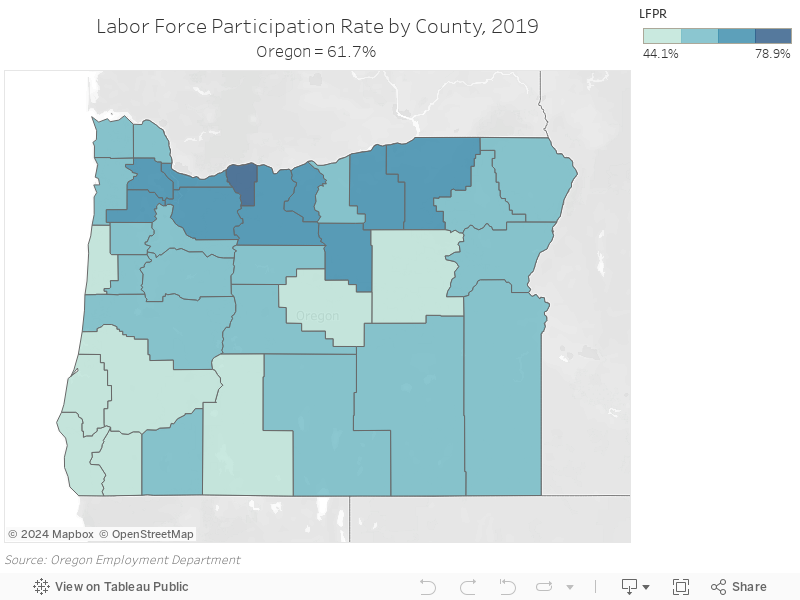
Generally, counties located in the Northern part of Oregon, and especially in the Columbia River Gorge, had higher LFPRs in 2019. Counties located along the coast, and in the Southern and Eastern parts of Oregon generally had lower LFPRs.
One factor associated with a county’s LFPR is the age composition of the population in that county. LFPRs vary by age group. People age 65 years and over have the lowest LFPRs of all age groups (19.3% in Oregon for 2019), as many individuals in this category are retired. Generally, Oregon counties that have a higher percentage of the population age 65 years and over tend to have lower labor force participation rates. The counties with the lowest LFPRs in Oregon tend to have higher percentages of the population that are age 65 years and over relative to other counties in Oregon – Curry County (35.0%), Crook County (25.2%), and Coos County (26.5%). On the other hand, the counties with the highest LFPRs all have low percentages of the population that are age 65 years and over – Hood River County (16.3%), Washington County (13.9%), and Multnomah County (13.9%).
Those in the age range of 16 to 24 years have a lower LFPR than the overall average; nearly 3.0 percentage points lower than the statewide average in Oregon in 2019. The counties in Oregon with the highest percentage of the population between the ages of 15 to 24 in 2019 – Benton County (25.8%), Polk County (16.3%), Lane County (15.6%), and Union County (14.9%) – are each home to a sizable university relative to the overall county population. As the presence of a university boosts an area’s population in this age range, the result is downward pressure on the LFPR since this age group tends to participate less in the labor force due to school attendance and related activities. The counties mentioned above all have LFPRs that were lower than the statewide average in 2019.
To learn more about Labor Force Participation Rates by County, read Local Area Unemployment Statistics Coordinator Tracy Morrissette's full article here.
No comments:
Post a Comment